Updated weekly technicals for US Dollar (DXY) – Breakout testing first major resistance hurdle.
In this series, we scale-back and take a look at the broader technical picture to gain a bit more perspective on where we are in trend. The US Dollar Index is up more than 9.3% off the yearly lows with the advance now approaching initial topside objectives. Here are the key targets & invalidation levels that matter on the US Dollar Index (DXY) weekly chart. Review this week’s Strategy Webinar for an in-depth breakdown of this setup and more.
US DOLLAR INDEX WEEKLY PRICE CHART (DXY)

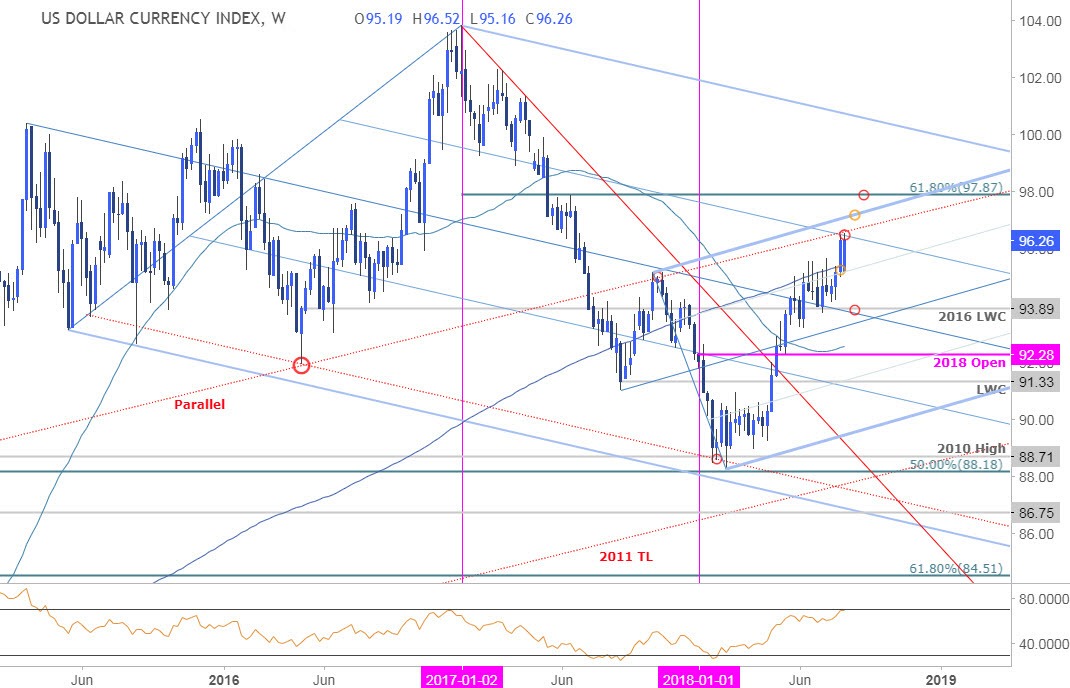
Notes: In last month’s US Dollar Weekly Technical Perspective we highlighted failure in the dollar index to close above the 200-week moving average while noting, “Topside resistance targets are unchanged in the event of a breach with such a scenario targeting 50% retracement at 96.04 backed by the slope confluence just higher around 97.10.” Price held below this threshold for since May with the dollar finally breaking higher last week.
The advance has already taken out the 96.04 target with price now testing confluence slope resistance around 96.50s. Note that this region is defined by the parallel of the 2011 trendline and broader downtrend pitchfork resistance (38.2% line) – the immediate advance may be vulnerable below this region near-term but the focus remains higher while above the 2016 low-week close at 93.89. Interim support rests back at the 50-line / 200-week moving average at 95.30s. A breach above this slope targets the 2017/2018 pitchfork resistance around 97.10/20 backed by the key 61.8% Fibonacci retracement / 2017 June high at 97.87.
Bottom line: The US Dollar is testing near-term resistance in both price and momentum early in the week. From a trading standpoint, look for a support hold above the 50-line (Friday’s low) IF price is indeed heading higher on this stretch.


No Comments