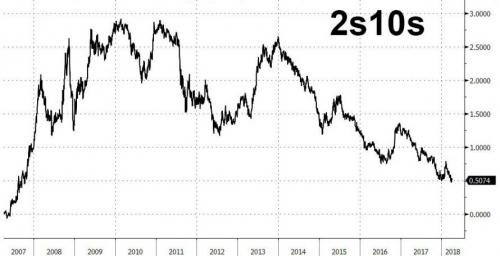
When it comes to timing the next recession – or the next Fed policy mistake – there are few signals that pundits rely more on than the shape of the yield curve, which, as we have covered extensively in the past year, has bear flattened dramatically since 2015 as the Fed has hiked rates, with the 2s10s now just 50bps away from inverting at which point the countdown to both a recession and a bear market begins.

However, at a time of unprecedented central bank meddling and manipulation in all rates (and equity) markets, many believe that the longer-dated curve is no longer indicative of anything but noise, especially at a time when the long-end is directly being bought by central banks (or sold by Chinese reserve managers depending on how much Trump’s trade war escalates) thus distorting any “signal” value it may have. In its place, a more accurate “signal” has emerged in the short-end of the curve, as manifested by the Overnight Index Swap, or OIS, futures market.
And it is here that something very notable has just happened: as JPMorgan observes the forward curve for the 1-month US OIS rate, a proxy for the Fed policy rate, has inverted after the two-year forward point, to wit:
The US yield curve has started showing first signs of inversion. As shown in Figure 1 which depicts the forward curve for the 1-month OIS rate the US yield curve is currently slightly inverted after the two-year forward point.

Another way of visualizing the inversion is by charting the front end between the 2-year and 3-year forward points of the 1-month OIS. Here, as the next chart shows, a curve inversion arose for the first time during the first week of January, but it only lasted for two days at the time and the curve re-steepened significantly in the following weeks.

However, The US OIS curve started immediately flattening again after the February equity correction and the spread between the 2y and the 3y forward points of the US 1-month OIS rate curve entered negative territory last week on March 29th; the spread has been hovering between +1bp and -1bp since March 19th suggesting that the current episode of yield curve inversion is more persistent than the brief inversion seen during the first week of January.


No Comments