EUR/USD
4 hour
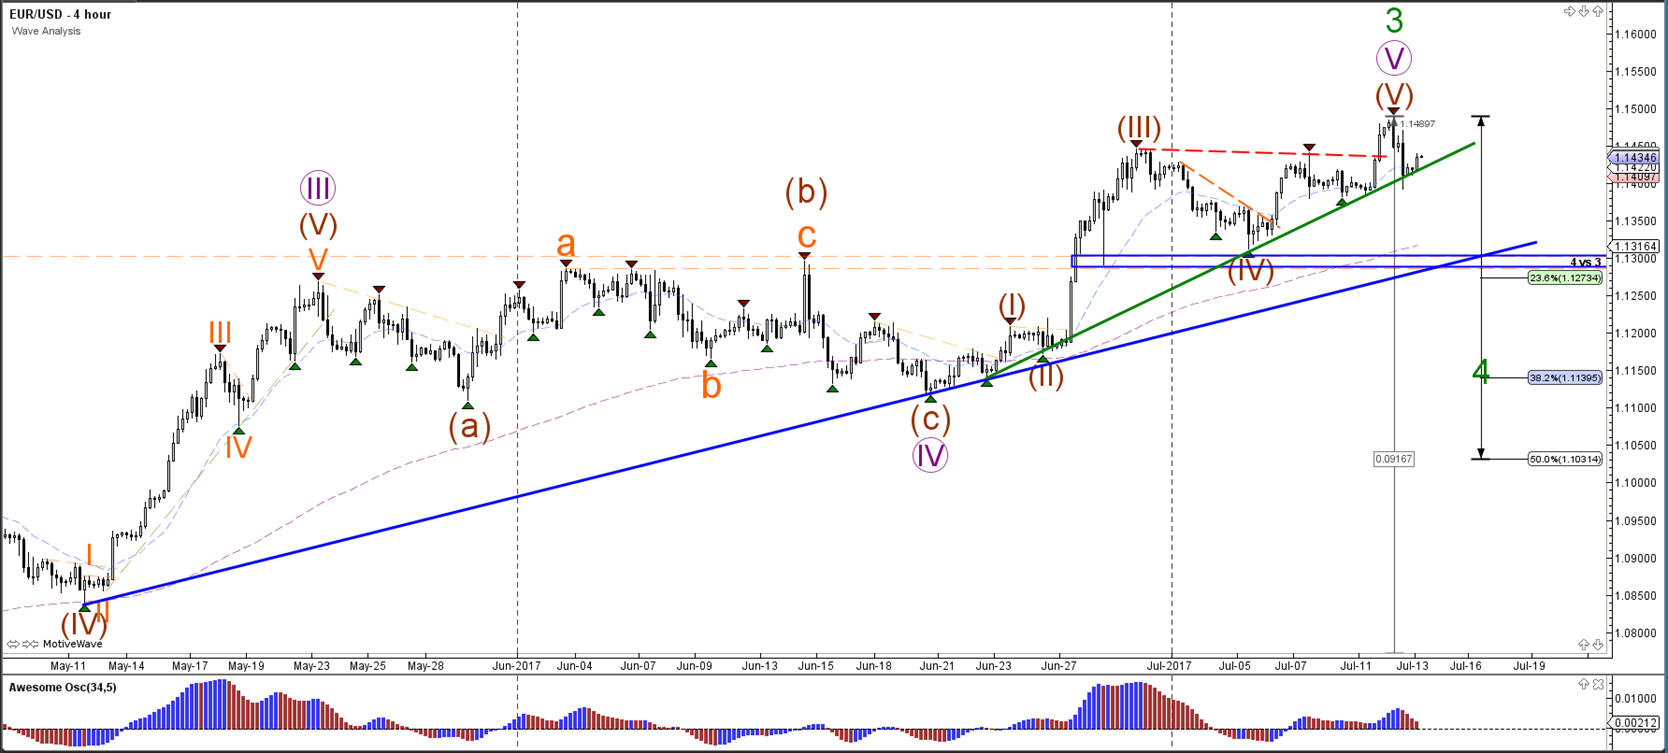
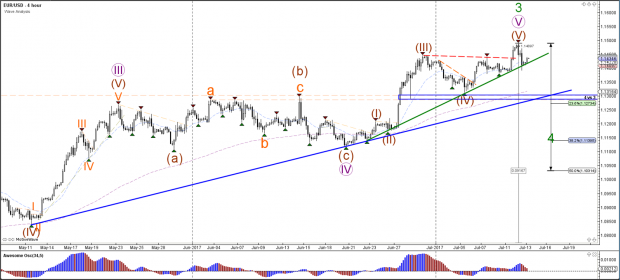
The EUR/USD bullish breakout reached the 1.15 target but then fell quickly down to 1.14. The bearish reaction could indicate that the waves 5 have been completed within wave 3 (green), which could indicate the start of a bearish retracement within wave 4 (green) towards the Fibonacci retracement levels of wave 4 vs 3. A break above 1.15, however, would indicate the revival of the uptrend and invalidate a larger correction within wave 4.
1 hour
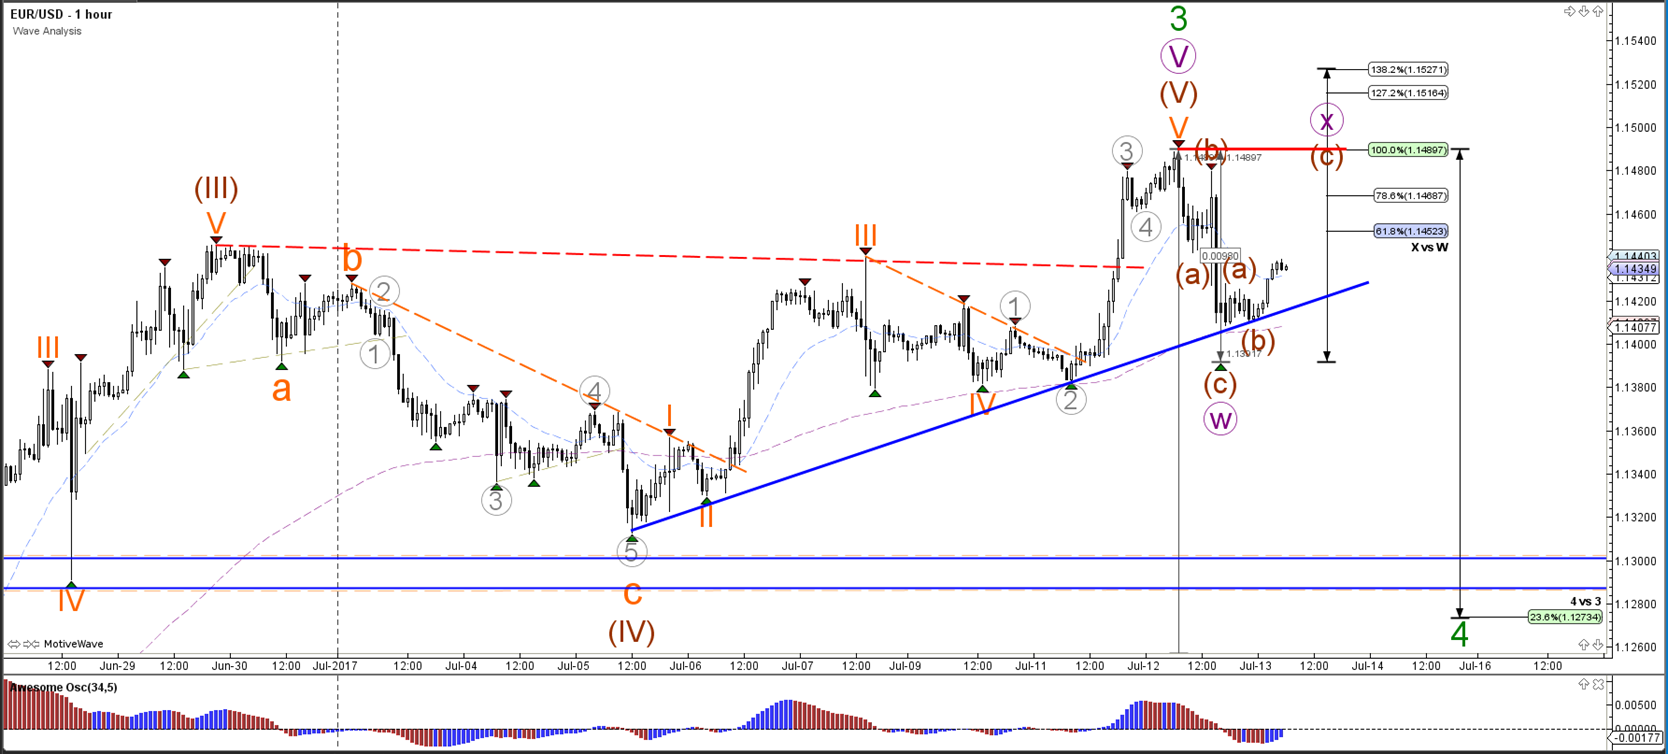
The EUR/USD could be building a bigger correction first before completing the wave 4 (green) retracement. Alternatively, the price could be in an uptrend if the EUR/USD manages to break above the resistance (red), 1.15 round level, and 138.2% Fib at 1.1527.
USD/JPY
4 hour
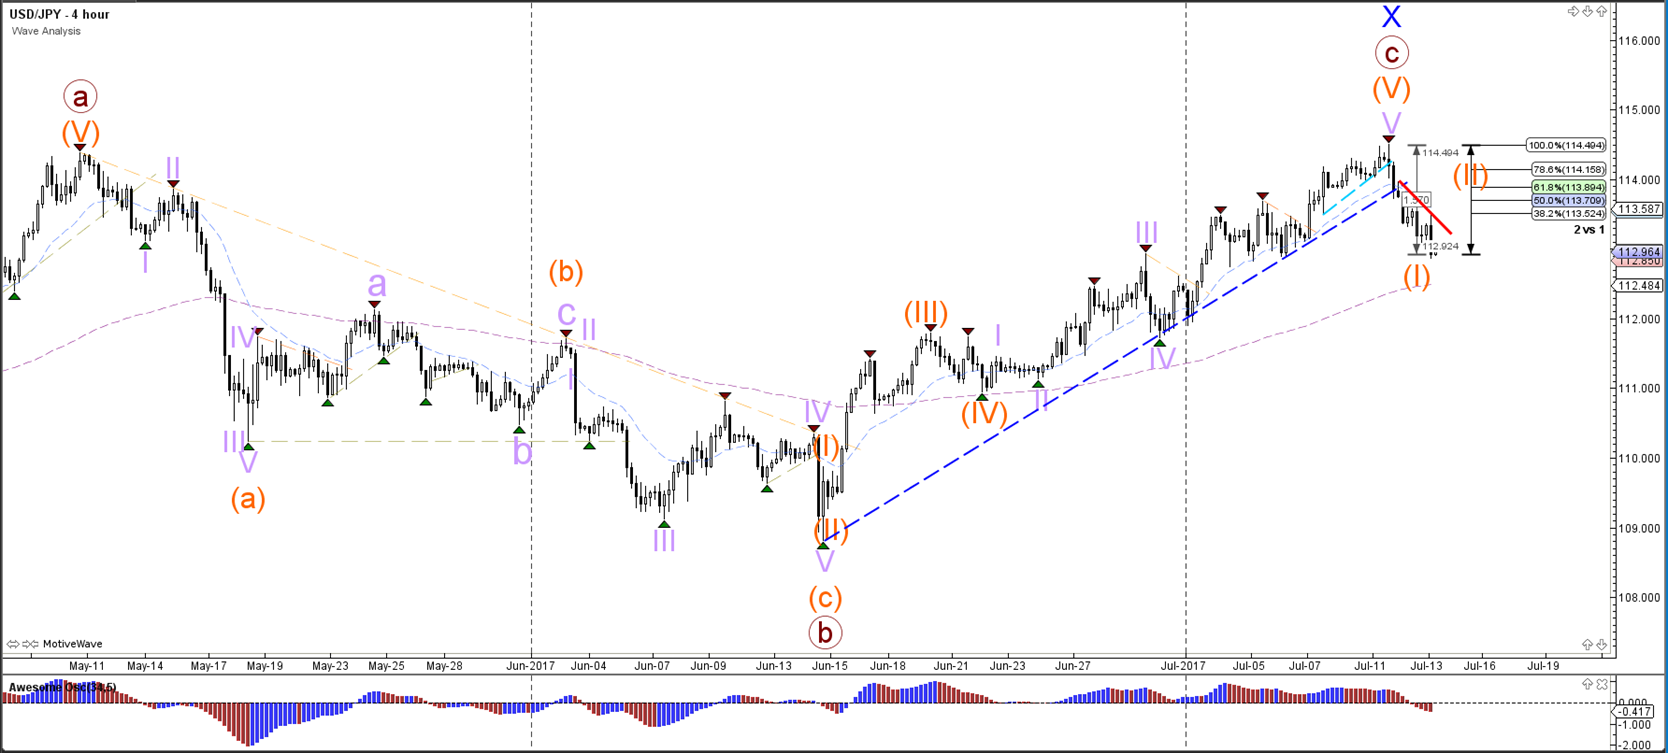
The USD/JPY made a bearish decline of about 150 pips after potentially completing wave X (blue). A new bearish trend could be in place if price respects the wave 2 (orange) Fibonacci levels. A break above the 100% level invalidates the wave 2 and downtrend.
1 hour
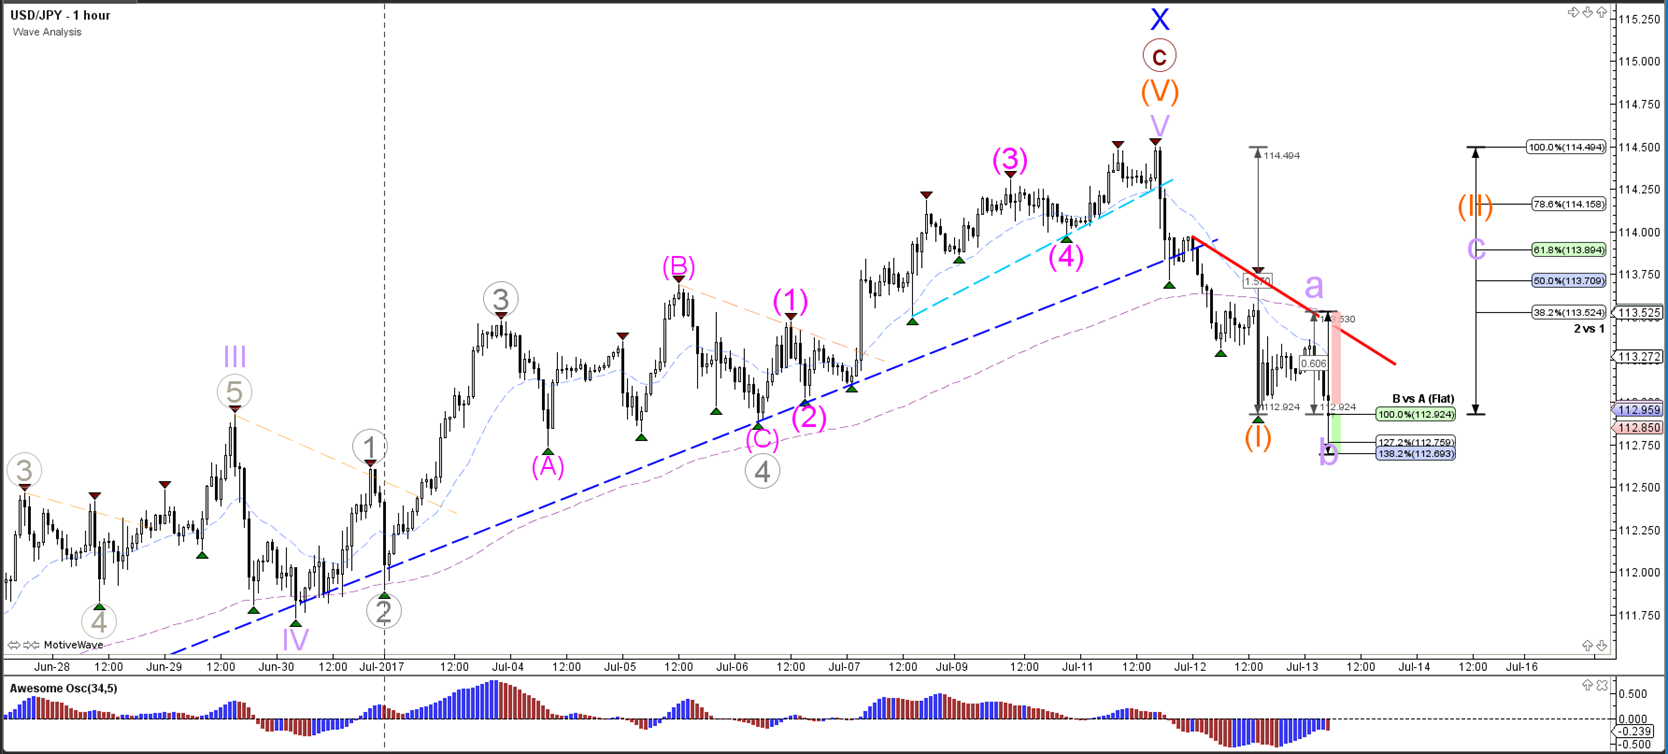
The USD/JPY could have completed a wave 1 (orange) and might be retracing for a wave 2 (orange) if the price stays above the 138.2% Fibonacci and below the 100% Fib of wave 2 vs 1. A break below the 138.2% support Fib could indicate a downtrend continuation where a break above the 100% resistance Fib invalidates the potential downtrend.
GBP/USD
4 hour
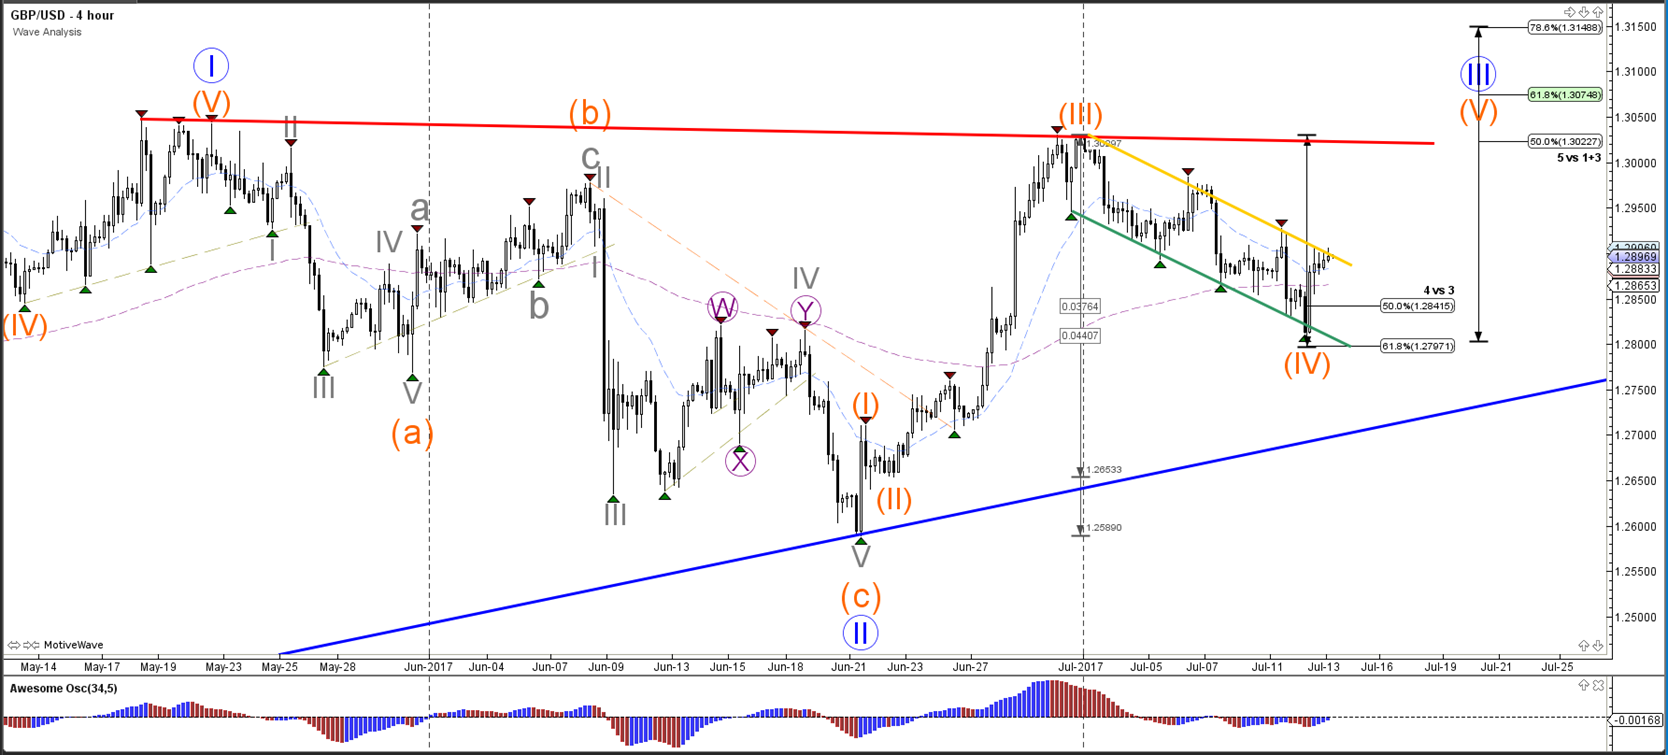
The GBP/USD made one more lower low but the price did not break below the 61.8% Fibonacci level. The wave is therefore still valid and price is now approaching the resistance trend line (yellow) of the bearish channel. A bullish breakout could see a wave 5 (orange).
1 hour
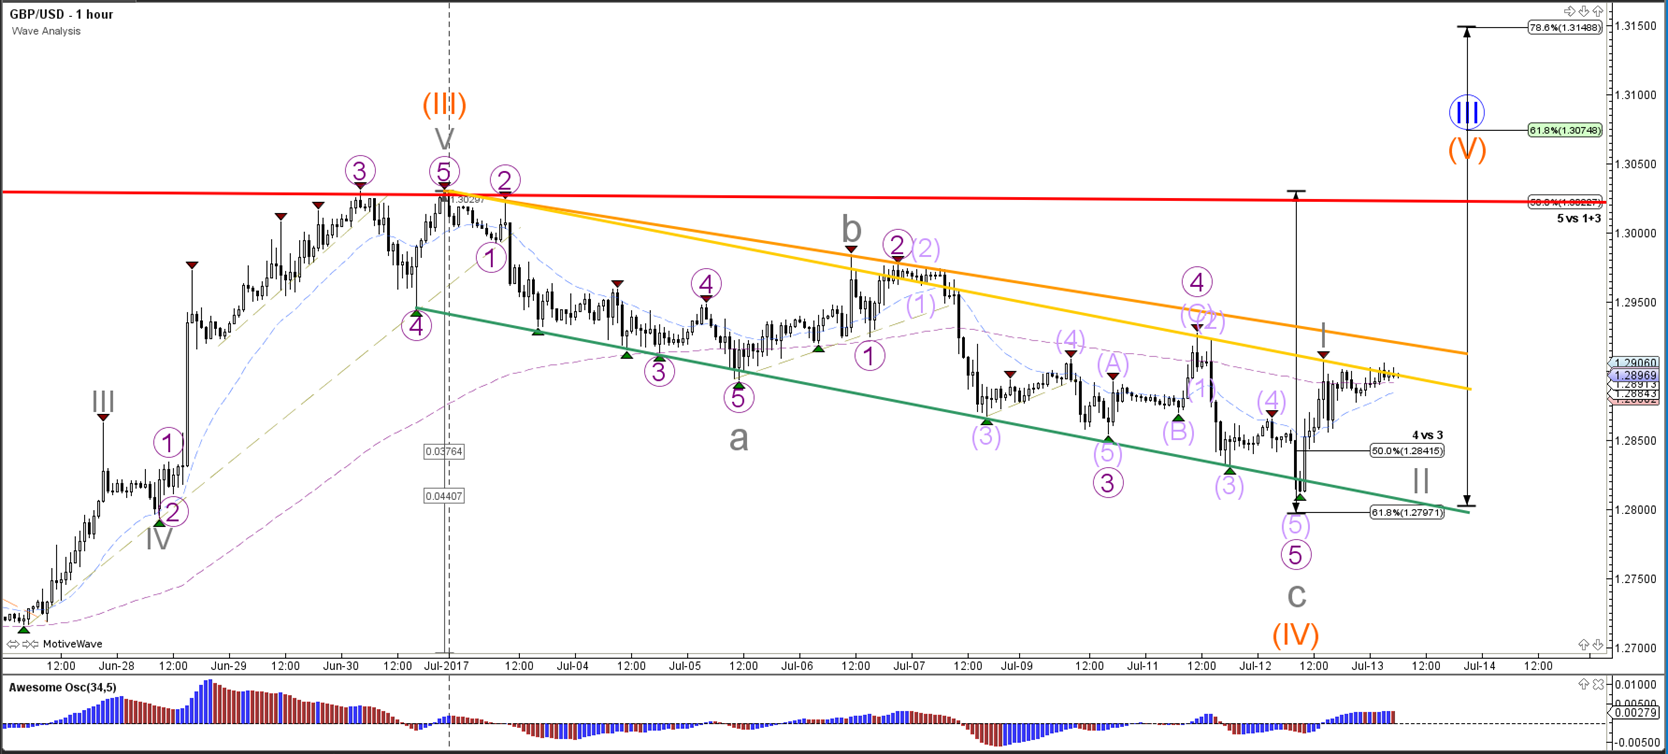
The GBP/USD could be in a wave 1-2 (gray) as long as the price stays above 1.28.



No Comments