A larger-than-expected drop in US inventories failed to make an impression on crude oil prices, as expected. Stockpiles shed 6.43 million barrels, a draw well in excess of the 3 million barrel outflow predicted by analysts. The outcome was well-telegraphed by previously released API data however, robbing the official EIA release of its market-moving potential.
Rather, the markets focused on rising production in Libya and Nigeria – OPEC countries that are nonetheless exempt from its output cut scheme – as well as the US. Bloomberg reported that the cartel’s collective output jumped by 315k b/d last month while DOE figures showed US exports jumped to 1.3 million b/d last week, the highest on record. Baker Hughes rig count data is next on tap.
Gold prices edged lower as upbeat US economic data offered a lift to the US Dollar, undermining the appeal of anti-fiat alternatives. ADP reported a forceful recovery in jobs growth and an ISM survey showed manufacturing-sector activity unexpectedly accelerated last month. The spotlight now turns to the official set of US employment figures, with an upbeat result poised to hurt the yellow metal further.
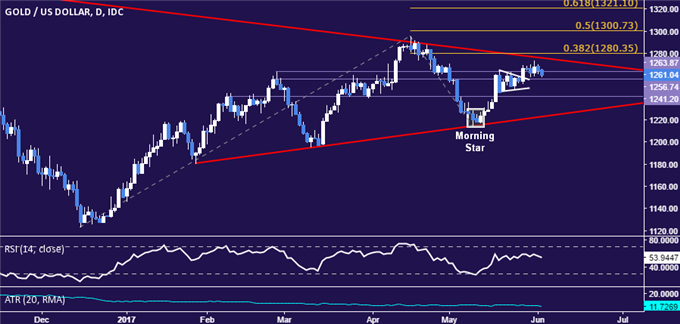
GOLD TECHNICAL ANALYSIS – Gold prices continue to mark time above resistance-turned-support in the 1256.74-63.87 area. Near-term resistance is at 280.35, the 38.2% Fibonacci expansion, with a daily close above that exposing the 50% level at 1300.73. Alternatively, a push below 1256.74 targets 1241.20.

Chart created using TradingView
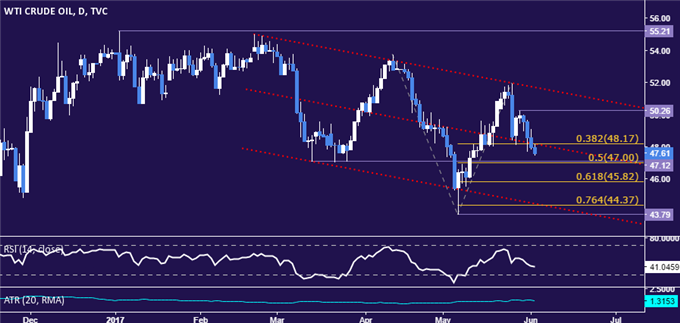
CRUDE OIL TECHNICAL ANALYSIS – Crude oil prices look set to test the $47/bbl figure after falling for a third consecutive day. A daily close below that targets the 61.8% Fibonacci expansion at 45.82. Alternatively, move back above the 38.2% level at 48.17 exposes the May 29 high at 50.26.

Chart created using TradingView


No Comments