The time period between spikes of inflation angst seems to be shortening. I am not sure yet about the amplitude of those spikes of angst, but the concern seems to be quickening.
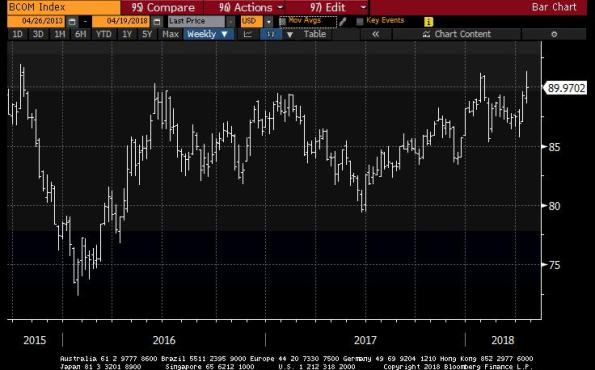
This is not without reason as it seems that concerning headlines are occurring with more frequency. This week the Bloomberg Commodity Index again challenged the 2016 and 2017 highs before backing off today (see chart, source Bloomberg).

Somewhat more alarming than that, to people who watch commodities, is how the commodity indices are rallying. The culprits are energy as well as industrial metals, and each has an interesting story to tell. Energy has been rallying partly because of global tensions, but also partly because US shale oil production appears to be running into some bottlenecks on production (wages, shortages of frack sand) as well as delivery (capacity constraints on pipelines), and part of what has kept a lid on energy prices over the last couple of years was the understanding that shale oil production was improving rapidly and becoming lots more efficient due to improved technology. If shale is limited, the ‘lid’ on prices is not as binding as we had thought. On industrial metals, some of the upward pressure has been due to fallout from US sanctions on Russia, a major supplier of aluminum and alumina. Since those sanctions were announced, aluminum prices have risen around 25%, and alumina (a raw input to aluminum production) about 50%, with knock-on effects in other industrial metals.
Both of these items bear on the market’s recent fears about new pressures on inflation – capacity constraints (especially rising wages for long-haul truckers) and potential fracturing of the global trade détente.
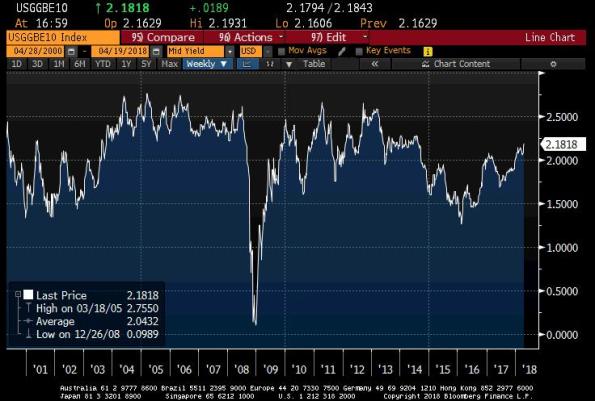
And 10-year breakevens are at new 4-year highs, although it is worth remembering that this is nowhere near the 10-year highs (see chart, source Bloomberg).

Shorter inflation swaps look less alarming, and not at new four-year highs. However, even here the news is not really soothing. The reason that shorter inflation swaps are lower than they have been in the past is because the energy curves are in backwardation – meaning that the market is pricing in lower energy process in the future. In turn, this means that implied core inflation – once we strip out these energy effects – are, in fact, at 4-year highs (see chart, source Enduring Investments).


No Comments