
Stocks Rise Following Breakout
In last week’s missive “Bulls Run On Yellen’s Easy Money,” I addressed the breakout and why we increased equity exposure modestly in portfolios.
“However, this changed this past week as Yellen uttered the two magic words: ‘EASY MONEY.’
Okay, it wasn’t exactly two words. It was actually:
‘Because the neutral rate is currently quite low by historical standards, the federal funds rate would not have to rise all that much further to get to a neutral policy stance.’
In other words, by saying that interest rates would not have to rise much further, the markets translated that to ‘lower interest rates for longer,’ confirming the Federal Reserve will remain “highly accommodative” to the markets so, therefore, ‘buy stocks.’
And with that, the robots leaped into action pushing markets OUT of the month-and-a-half long trading range of just 1.5%. This push to new highs, as noted above, also triggered a short-term ‘buy signal,’ at the bottom of the chart, which suggests this rally should continue higher over the next week, or so, heading into the month of August.”
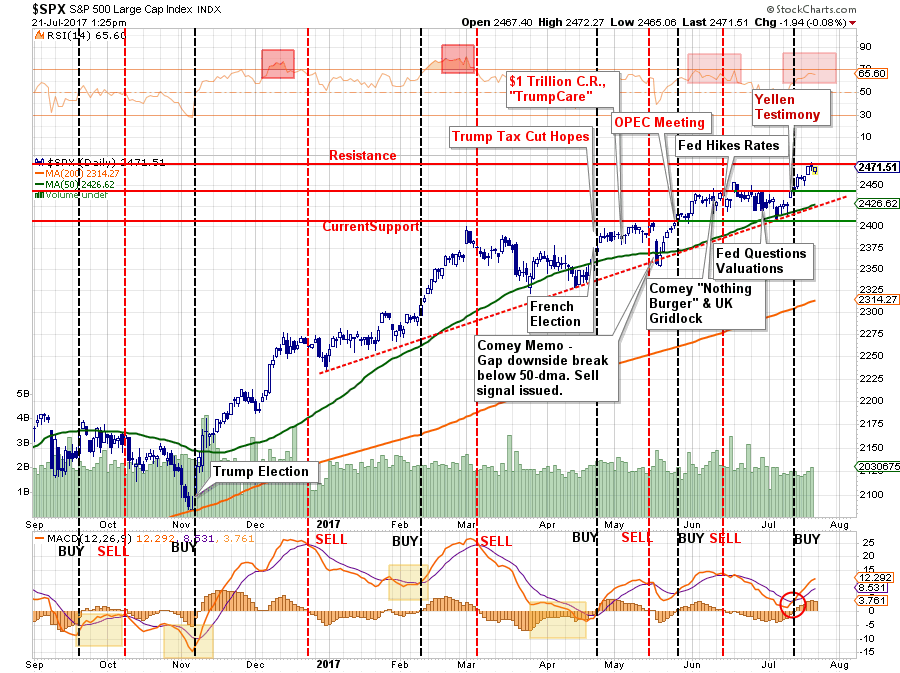
“With the break above 2452 on Friday, assuming it will hold above that level into next week, it will provide an opportunity to increase short-term equity allocations in portfolios. However, be mindful, this is VERY short-termin nature and could be quickly reversed – so manage your risk accordingly.”
As stated, this analysis is VERY short-term in nature. Price trends are currently positive which keeps portfolios long-biased for the time being. However, while our portfolios are “bullishly” positioned for the short-term, we remain much more pessimistic about the longer-term return dynamics.
I want to spend the rest of this weekend’s missive analyzing the ongoing bull thesis that has been pushed out by the media recently.
Analyzing The Bull Thesis
Michael Santoli via CNBC
“Exactly a decade ago, it was time for investors to start worrying, even as stocks sat at record highs and the signs of onrushing danger were far from obvious.”
I am not so sure that warning signs weren’t obvious. Starting in mid-2007, the market began to struggle to make gains and initial “sell signals” were given as internal measures began to deteriorate.
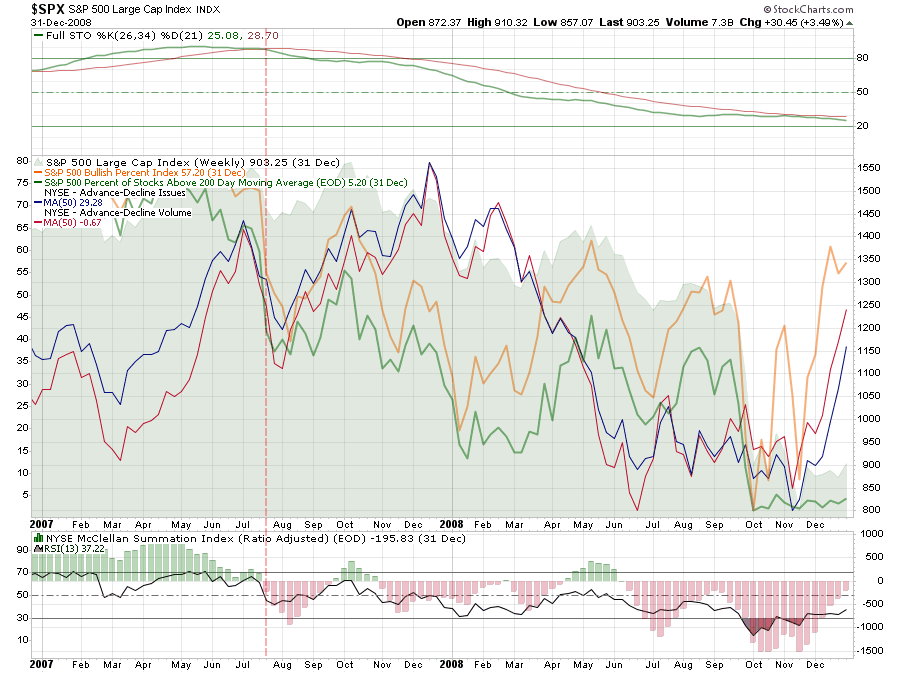
Furthermore, as shown in the chart below, the “financial crisis” was not a sudden event. Had investors been paying attention to the market, rather than listening to the advice of “buying the dips” or Fed Chairmen declaring “subprime is contained” and “it’s a Goldilocks economy,” there were three separate opportunities to step aside BEFORE the Lehman event ever occurred.
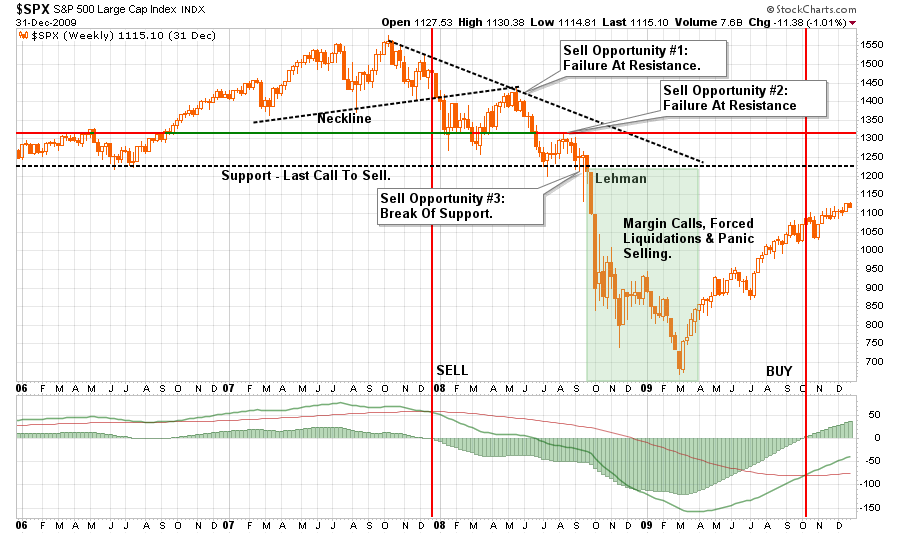
Yet, in 2007, much like today, individuals were being told to disregard much of the same evidence that existed then as they are today. Let’s take a look at a few of the arguments being made currently.
Earnings Growth Is Driving The Markets
The bulls currently have the “wind at their backs” as the continued “hope” the Trump administration will foster an age of deregulation, infrastructure spending and tax cuts which will boost corporate earnings in the future. Shortly after the election in 2016, Jack Bouroudjian via CNBC wrote:
“Let’s be clear, this market run up to the 20K level has a much more solid foundation for valuation. We are not looking at a P/E which has been stretched beyond historical norms as was the case in 1999, nor are we looking at a dot com bubble ready to implode. On the contrary, between digestible valuations and the prospects of real pro-growth policies, we have the foundation for a run up in equities over the course of the next few years which could leave 20K in the dust.”
The problem is 9-months later there has been no advancement on that legislative agenda while the markets have surged more than 18% since the election. As I discussed previously, the market has already priced in the expected earnings growth from the “promised” Trump agenda which puts the market in danger of disappointment.
“Given that stocks have surged based on ‘hopes’ of deeper tax cuts, a tax cut only roughly half of previous estimates certainly puts valuations at risk. Once again, the market has already priced in earnings growth through 2018, making disappointment a much higher probability.”
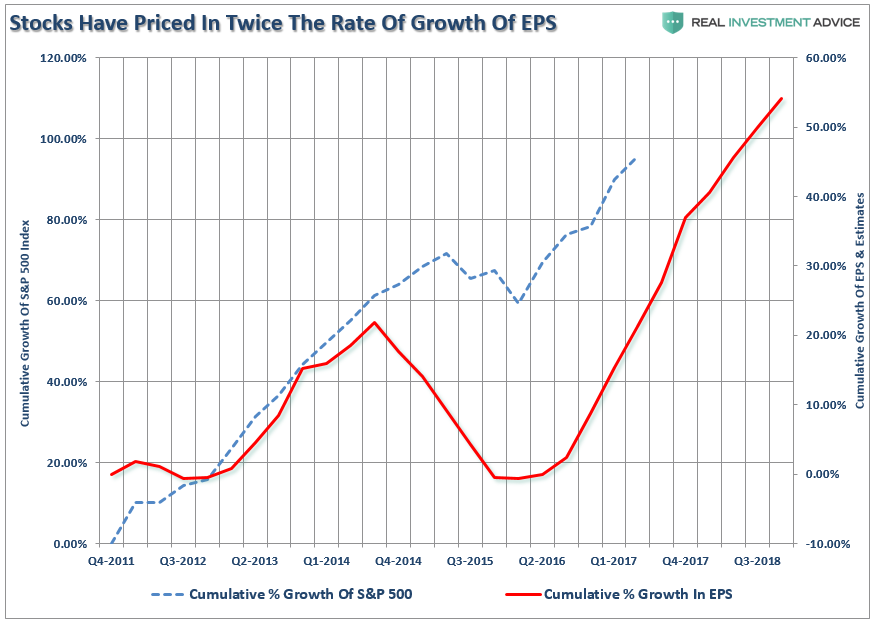
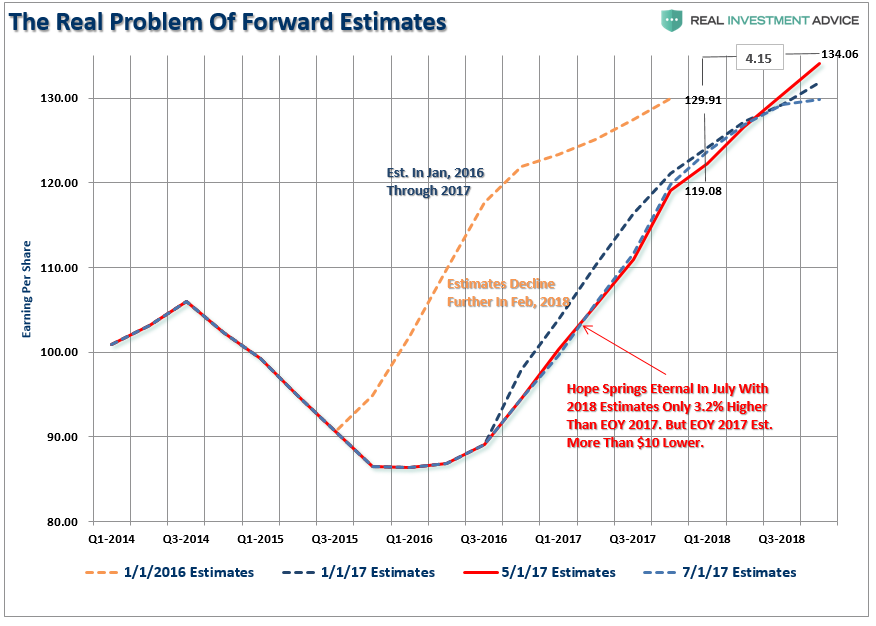
“Considering that forward estimates are generally overstated by 33% on average, the risk is high of disappointment. As shown below, there was a $10 difference between what earnings were expected to be in 2017 at the beginning of 2016 and today. Furthermore, forward earnings have only risen by $4.15/share for the end of 2018. Yet, as shown, above prices have more than priced in that future growth.“
However, as Dr. Lacy Hunt recently discussed, this may not be the case.
“Considering the current public and private debt overhang, tax reductions are not likely to be as successful as the much larger tax cuts were for Presidents Ronald Reagan and George W. Bush. Gross federal debt now stands at 105.5% of GDP, compared with 31.7% and 57.0%, respectively, when the 1981 and 2002 tax laws were implemented. Additionally, tax reductions work slowly, with only 50% of the impact registering within a year and a half after the tax changes are enacted. Thus, while the economy is waiting for increased revenues from faster growth from the tax cuts, surging federal debt is likely to continue to drive U.S. aggregate indebtedness higher, further restraining economic growth.
However, if the household and corporate tax reductions and infrastructure tax credits proposed are not financed by other budget offsets, history suggests they will be met with little or no success. The test case is Japan. In implementing tax cuts and massive infrastructure spending, Japanese government debt exploded from 68.9% of GDP in 1997 to 198.0% in the third quarter of 2016. Over that period nominal GDP in Japan has remained roughly unchanged. Additionally, when Japan began these debt experiments, the global economy was far stronger than it is currently, thus Japan was supported by external conditions to a far greater degree than the U.S. would be in present circumstances.”



No Comments