Latest Posts
-
Finance 0
And Now For A Hard Drop In Comex Deliverable Silver
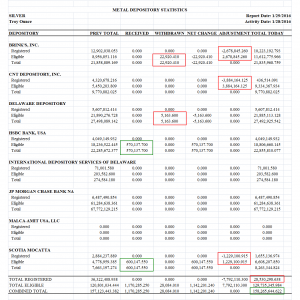
The ‘registered’ for delivery silver bullion at the Comex licensed facilities dropped by 7,792,110 troy ounces yesterday. This takes the total from 36,322,409 to 28,530,299. This is a one day decline of 21.5%. This also brings the total deliverable silver down to some unfamiliar lows not seen since 2011. The level is not nearly as extreme as gold’s, but it is getting there if this keeps up. I include a chart of the registered silver at Comex for the last ten years below. Silver in these warehouses has been seeing some large movements for some time now, a fact which I attributed to CNT using the Comex as a delivery mechan...On January 29, 2016 / By Kurt Osterberg -
Finance 0
Why Are Treasury Bonds The Ultimate Safe Haven?
The last 10 years have exposed a very important reality for any global asset allocator – US Treasury Bonds are the ultimate safe haven investment. For decades we have heard stories about how gold, silver, real assets or other types of financial instruments would serve as the “safe haven” investment during times of crisis. Many of these stories were based on mythical ideas about the coming collapse of fiat money or the bankruptcy of the US government. There have also been endless discussions about the coming collapse of the T-Bond market due to a “bond bubble” or the end of Qthe end of Q. But every time the global economy...On January 29, 2016 / By Kurt Osterberg -
Finance 0
No Change In Outlook For Gold & Silver
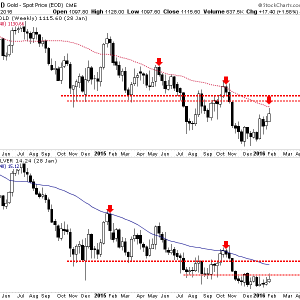
With each passing rally hope has bloomed that the bear market in precious metals may be over. The long and deep “forever bear” has to end but it hasn’t yet. Under the surface, the bear market is getting weaker and Gold is growing stronger. It’s showing strength against foreign currencies and has broken its downtrend relative to equities. These are very positive developments and a precursor to the birth of a new bull market. However, the weak rebounds in the metals coupled with the potential for a US Dollar breakout advise us to continue to remain patient and cautious. In looking at the price action in both Gold and Silver I see no cha...On January 29, 2016 / By Kurt Osterberg -
Finance 0
The Question Is Not A Difficult One To Answer
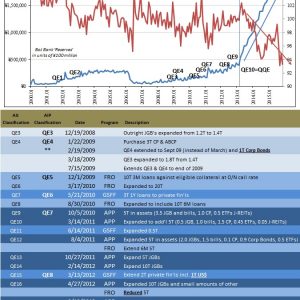
At what point do we accede back to logic and rational thought? The Bank of Japan is “forced”, not my word, to unleash negative nominal interest rates and that is taken as a positive for everyone everywhere. Such a move is, without question, an open admission that QQE failed and failed spectacularly (since it was even expanded not really that long ago). That is cause for celebration and optimism? Bloomberg tells us that a grim January gets to now end on a high note (that was the article’s title, after all) without ever pausing to consume the fact that January was so grim to begin with because nothing central banks do actually matter be...On January 29, 2016 / By Kurt Osterberg -
Finance 0
The Federal Reserve Ignores Financial Markets
The Federal Reserve’s announcement of its decision to leave monetary policy unchanged said nothing about stock market and commodity market volatility. And that speaks volumes. The closest the Fed came to talking about markets was measures of inflation expectations that are embedded in the prices of inflation-indexed bonds; and cheap oil’s impact on the measured inflation rates; and the rising foreign exchange rate’s impact on imports, exports and the prices of imported goods. Back in the day, we talked about the “Greenspan put,” in which the Fed would react to stock market downturns with a cut in interest rates. The Fed seems to...On January 29, 2016 / By Kurt Osterberg -
Finance 0
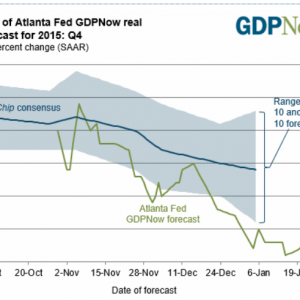
BEA 4th Quarter GDP 1st Estimate 0.7%; Q&A: Why Did GDPNow Rise After Durable Goods?
The BEA “Advance GDP” estimate for 4th quarter came in today at +0.7% vs. an Econoday Consensus Estimate of 0.9%. Consumer spending is the central driver of the economy but is slowing, at least it was during the fourth quarter when GDP rose only at a 0.7 percent annualized rate. Final demand rose 1.2 percent, which is the weakest since first quarter last year but is still 5 tenths above GDP. Price data are not accelerating, at plus 0.8 percent for the GDP price index which is the lowest reading since plus 0.1 in the first quarter last year. The core price reading is only slightly higher, at plus 1.1 percent which is also the ...On January 29, 2016 / By Kurt Osterberg -
Finance 0
The U.S. Is Not In A Recession
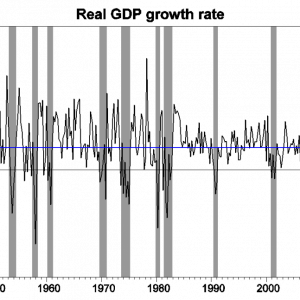
The Bureau of Economic Analysis announced today that U.S. real GDP grew at a 0.7% annual rate in the fourth quarter. That’s a bad quarter to be sure, and real GDP is up only 1.8% from a year ago. That’s a weak year judged by the U.S. postwar average of 3.1%, but is not far from the 2.1% annual growth we’ve been averaging since 2009:Q3. Real GDP growth at an annual rate, 1947:Q2-2015:Q4, with historical average (3.1%) in blue and post-Great-Recession average (2.1%) in red. One concerning detail in today’s report was that nonresidential fixed investment fell during the quarter, pulled down in part by slashed capital spending in the oi...On January 29, 2016 / By Kurt Osterberg -
Finance 0
HowTo Tell When The Next Market Crash (Or Rally) Is Coming
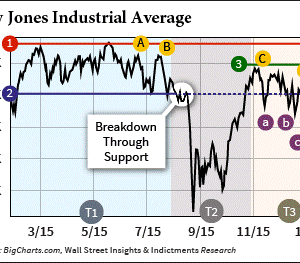
We know that the Dow Jones Industrial Average is off more than 10% since July 1 in a correction that has investors all over the world rattled. But here’s the thing… I’ve been able to predict every step of the sell-off, whenever stocks were set to make the next move down. Right before each drop, I told investors what they could do to protect themselves and even make some nice, easy money during the sell-off. I made the predictions here in Money Morning, and on FOX Business, too. But what I didn’t tell FOX audiences was just how easy it is to predict when these dives are going to happen. In fact, it’s incredibly ...On January 29, 2016 / By Kurt Osterberg -
Finance 0
More Damage
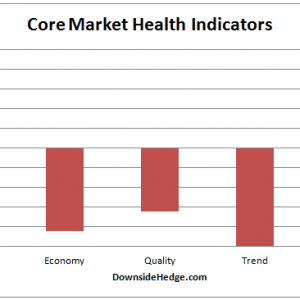
This week wasn’t a good week for my core market health indicators. My measures of market quality, trend, and strength all fell even as the market rallied on Thursday and Friday. This isn’t what the bulls want to see for a sustained rally. So far, this is looking like a bear market rally rather than the start of a new intermediate or long term uptrend. If we have entered a bear market (Dow Theory hasn’t confirmed a bear market yet) then bear market rules will apply to how I read various indicators. Elder Impulse for the S&P 500 Index on a weekly chart is a good example. Notice that during a bull market a blue bar that follows a red b...On January 29, 2016 / By Kurt Osterberg -
Finance 0
If History Rhymes This Indicator Suggests Stocks Still Have A Long Way To Fall
The latest NYSE margin debt figures came out this week showing another drop during the month of December. Moreover, the level of margin debt has now spent a few months below its 12-month moving average, which has been a decent bear market signal in the past (first proposed by Norman Fosback). Even when adjusted for the size of the overall economy, margin debt recently hit record high levels, greater even than what we saw at the peaks just prior to the dotcom bust and the financial crisis. The reason I like to look at margin debt relative to GDP is that is it fairly negatively correlated with forward 3-year returns in the stock market. When l...On January 29, 2016 / By Kurt Osterberg
Top Posts
-
 The Importance for Individuals to Use Sustainable Chemicals
-
 Small Businesses: Finding the Right Candidate for the Job
-
 How to Write the Perfect Thank You Letter After Your Job Interview
-
 3 Best Large-Cap Blend Mutual Funds For Enticing Returns
-
 China suspected in massive breach of federal personnel data


