Latest Posts
-
Finance 0
The Reemergence Of Emerging Markets
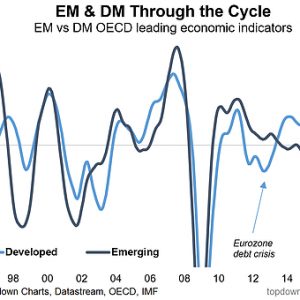
Going through the latest numbers from the OECD Composite Leading Indicators data set I thought it would be worth sharing a couple of what I thought were particularly interesting charts. As the title suggests, they basically show the reemergence of emerging markets (from a cyclical perspective). The first chart shows the GDP weighted OECD leading indicators for emerging markets and developed markets, and you can see a major turnaround has taken place for emerging market economies, in aggregate. While there are few exceptions within emerging markets, the extent of the turnaround is just as remarkable as the downturn from which they came...On September 11, 2017 / By Kurt Osterberg -
Finance 0
Oil Market Supply/Demand Finally Begins To Matter Again As Commodity Funds Withdraw
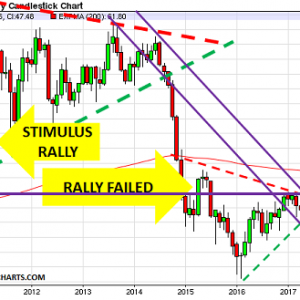
It’s been a long time since oil market supply/demand was based on physical barrels rather than financial flows: First, there was the subprime period, when the Fed artificially boosted demand and caused Brent to hit $147/bbl Then there was QE, where central banks gave free cash to commodity hedge funds and led Brent to hit $127/bbl In 2015, as the chart highlights for WTI, the funds tried again to push prices higher, but could only hit $63/bbl Then, this year, the funds lined up to support the OPEC/Russia quota deal which took prices to $55/bbl As the Wall Street Journal reported: “Dozens of hedge-fund managers and oil traders atten...On September 11, 2017 / By Kurt Osterberg -
Finance 0
Middle East Economic Challenges (As The Role Of Fossil Fuels Declines)
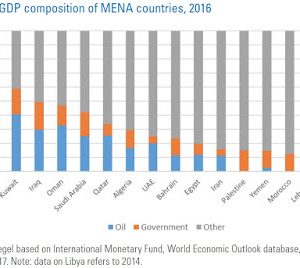
The Middle East and North Africa region contains about half of the world’s proven reserves of oil and natural gas. This has already proven to be a mixed blessing for economic growth in the region, and in a world economy where many countries are making efforts to reduce carbon-emitting sources of energy, a dependence on production of fossil fuels will be even more problematic. Abdelhak, Bassou, Mario Filadoro, Larabi Jaidi, Marion Jansen, Yassine Msadfa, and Simone Tagliapietra consider these isues in “Towards EU-MENA Shared Prosperity,” a report recently co-published by the European think tank Breugel and the Moroccan thin...On September 11, 2017 / By Kurt Osterberg -
Finance 0
No ‘Apocalypse Now’, But Maybe Later – Full Week Ahead Preview
The apocalypse is on hold. Although the human suffering will no doubt be profound, damage estimates from Hurricane Irma are already being rolled back on Sunday evening as the worst case scenario doesn’t seem to have materialized. Similarly, Kim hadn’t launched any more ICBMs as of early Asian trading and that prompted the yen to fall versus all its G-10 peers out of the gate. Equity futs rose and gold fell. “The market was already braced for a mammoth hurricane at the end of last week and the pricing of another Fed rate hike any time soon has already dwindled, so there’s scope for a brief relief rally in the greenback and risk assets...On September 11, 2017 / By Kurt Osterberg -
Finance 0
Why Investing In A Fixed Deposit Is Favourable?
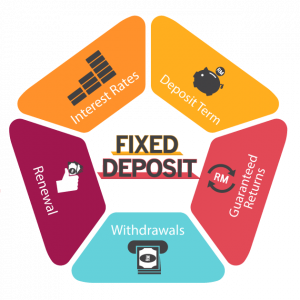
An investment in an equity might be beneficial in generating high returns in the long run. However, they are not risk-free. Fixed Deposit, on the contrary, offers sizeable returns but is risk-free. FDs are the best investment options when it comes to parking your surplus income. This debt asset instrument is one of the most popular choices among investors. Yes, the current fixed deposit rates being offered by the banks are not as good as they once were. However, there are Non-Banking Financial Companies (NBFCs) who are still offering a higher rate of interest. There are various banks throughout the country which offer the rate of interest b...On September 11, 2017 / By Kurt Osterberg -
Finance 0
EUR/USD Retesting 1.20 Support In Key Decision Zone
EUR/USD 4 hour The EUR/USD challenged the previous top (red) but till now has been unable to break above that resistance. A bullish break could be part of a potential wave 3 (pink) whereas a failure to break above the 138.2% Fib of wave B vs A at 1.2165 could still indicate a wave B (red). 1 hour The EUR/USD invalidates wave 4 (green) with a potential break below the 61.8% Fib of wave 4 vs 3 and the support trend line (blue), which could indicate a larger ABC (red) correction. A break above the resistance trend line (red) could start a wave 5. Price is now at the 38.2% Fib at 1.20. GBP/USD 4 hour The GBP/USD is challenging a deep 88.6% resist...On September 11, 2017 / By Kurt Osterberg -
Finance 0
Quiet Korea Sparks Panic Bid For Stocks, Dollar As Gold, Yen Dumped On Asia Open
The end of the world did not happen… Buy stocks, dump gold, and back up the dollar truck… Safe-Haven precious metals, bonds, and Yen are for losers… It’s stocks you want… And load up on dollars…...On September 11, 2017 / By Kurt Osterberg -
Finance 0
EURUSD Daily Analysis – Monday, Sept 11
EURUSD stays above the bullish trend line from 1.1662 to 1.1823 and remains in the uptrend from 1.1662. As long as the price is above the trend line, the upside movement could be expected to continue and next target would be at 1.2165. On the downside, a clear break below the trend line support could bring price back to test 1.1823 key support, only break below this level could signal completion of the uptrend....On September 11, 2017 / By Kurt Osterberg -
Finance 0
Dollar, Futs On The Rebound Early As Irma, Kim ‘Disappoint’
Well, I suppose this was inevitable. With yields, gold, and the dollar all having priced in a Cat. 5 landfall from Irma and another ICBM launch from North Korea headed into the weekend, anything short of the worst case scenario was bound to be met with something of a relief rally. As Bloomberg notes, the dollar opened “higher against most G-10 peers on position unwind by investors as perceived risks including North Korea missile test and hurricane Irma hitting landfall as category 5 fail to materialize.” Here’s USDJPY: S&P futs on the move: And here’s USDCHF rallying as well: No nuclear war and apparently, Irma will not in fac...On September 11, 2017 / By Kurt Osterberg -
Finance 0
Which Of These 5 Stocks Will Win This NFL Season?
NFL season is now upon us. So far Kansas City Chiefs have recorded a shock defeat of the defending Super Bowl LI champion New England Patriots 42–27 in the NFL Kickoff Game. To mark the first week of play, we decided to take a quick look at the team owners and rank them according to their business interests. Which is the winning NFL stock according to the Street? Let’s kickoff and find out. Robert Kraft- the chairman and CEO of the Kraft Group, Robert Kraft is also the owner of the New England Patriots. He purchased the team for $172 million in 1994 with profits from his paper and packaging conglomerate; they are now worth $3.4 billion. ...On September 11, 2017 / By Kurt Osterberg
Top Posts
-
 The Importance for Individuals to Use Sustainable Chemicals
-
 Small Businesses: Finding the Right Candidate for the Job
-
 How to Write the Perfect Thank You Letter After Your Job Interview
-
 3 Best Large-Cap Blend Mutual Funds For Enticing Returns
-
 China suspected in massive breach of federal personnel data


