Latest Posts
-
Finance 0
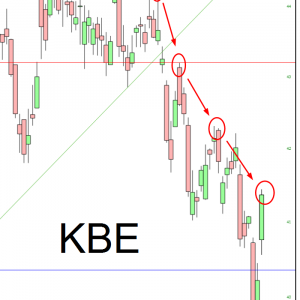
Finance Stocks – Lower Highs
Notice a trend here? It’s hard to believe on a day like this, but keep your perspective....On September 11, 2017 / By Kurt Osterberg -
Finance 0
Agriculture Markets Report – Monday, Sept 11
Video Length – 00:08:06...On September 11, 2017 / By Kurt Osterberg -
Finance 0
Are The Transports About To Take Off To New Highs!
Last week the stock indexes were stuck in a tight range, as the TLT and GLD rallied while the dollar fell (UUP). Despite the apparent building fear in the markets, the VXX just consolidated. Today, last week came undone. TLT, VXX, and GLD all had big declines and the SPY broke out to new highs with its biggest one day percent gain since April. Interestingly, some of the big movers were IYR (Real Estate), and XLU (Utilities). These moves seem counter intuitive to the recent correlation with TLT which was down big today. Plus, these aren’t areas that would give the bulls confidence for a continuation of the SPY’s breakout. However, both IYR...On September 11, 2017 / By Kurt Osterberg -
Finance 0
EUR/USD: Is It Time To Buy The Dip?
EUR/USD has retreated from the highs, mostly on profit-taking from the big sell-off of the US dollar. It previously advanced thanks to Draghi’s unconvincing complaints about the exchange rate. What’s next? Here are three opinions: Here is their view, courtesy of eFXnews: EUR/USD: Markets Likely See A Scope For A Move Towards 1.25 – BTMU BTMU FX Strategy Research notes that ECB’s changes to the inflation forecasts at its September meeting and the fact that President Draghi confirmed QE tapering plans were being compiled and would be divulged in October highlighted the extent of EUR appreciation needed to alter the path of monetary po...On September 11, 2017 / By Kurt Osterberg -
Finance 0
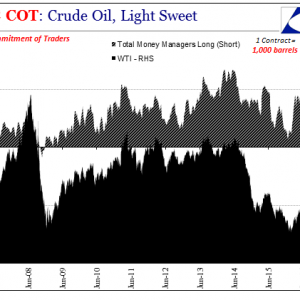
COT Report: Black (Crude) And Blue (UST’s)
Over the past month, crude prices have been pinned in a range $50 to the high side and ~$46 at the low. In the futures market, the price of crude is usually set by the money managers (how net long they shift). As discussed before, there have been notable exceptions to this paradigm including some big ones this year. It was earlier in February when money managers piled in to WTI longs, apparently expecting better things from “reflation.” It was perceived as such a sure thing that by the week of February 21the market was stretched at a record to that side. Oil prices did not follow, however, and then began to slide as managers rethought wh...On September 11, 2017 / By Kurt Osterberg -
Finance 0
Respectable Gains Offer Test Of Highs
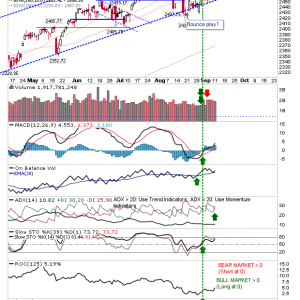
So with markets threatening support they instead gap higher and post further gains. Today has probably done enough to see markets post new all-time highs while shorts are left with little to work with. The S&P gapped higher with technicals net bullish. Volume was a little disappointing (given the degree of gain) but all of this leaves markets ready for new highs. The Nasdaq gapped on higher volume accumulation. The index hasn’t yet managed new highs but tomorrow could be the day this happens. Look for a move to upper channel resistance. The Russell 2000 was the index offering the best chance for bulls. Today was a good solid dayR...On September 11, 2017 / By Kurt Osterberg -
Finance 0
Alteryx Lock-Up Expiration Could Send Share Price Downward
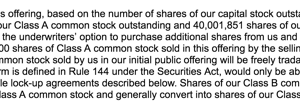
Event Overview Alteryx (NYSE:AYX) made its market debut on March 23, 2017, raising $126 million through its offer of 9 million shares. Shares priced at $14, the high end of its initial price range of $12 to $14, then jumped 10% on its first day of trading. Since then, the stock price has continued to move up. Currently, shares are up approximately 57% from the IPO price and are currently trading at approximately $22. (9.7.17) The 180-day lock-up period which restricted insiders ability to trade shares will expire on September 20, 2017. At this point, the company’s pre-IPO insiders will be able to sell their 40M shares for the first time...On September 11, 2017 / By Kurt Osterberg -
Finance 0
USDJPY Analysis: Testing Important Cloud Resistance
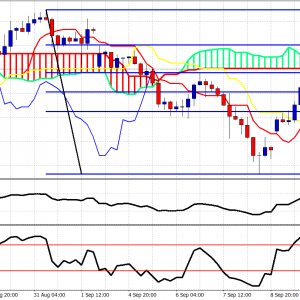
In the 4 hour chart as shown below, USDJPY is now testing important Kumo (cloud) resistance. At current levels, the price is at the 61.8% Fibonacci retracement of the decline from 110.66 to 107.31. Short-term support is found at 109.25-109.05. If this area is broken downward we could see a rejection that could start the next leg down in USDJPY. Daily trend remains bearish as price is below the Daily Kumo and the downward sloping black Trend line as shown below. Thank you for taking the time to catch up on my thinking….....On September 11, 2017 / By Kurt Osterberg -
Finance 0
World Markets Update – Monday, September 11
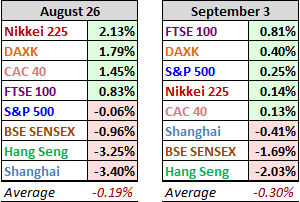
All eight indexes on our world watch list have posted gains for 2017 through September 11. The top performer thus far is Hong Kong’s Hang Seng with a gain of 27.07%, followed closely by India’s BSE SENSEX at 19.74%. In third is our own S&P 500 with 11.13%. The Last Four Weeks The tables below provide a concise overview of performance comparisons over the last four weeks for these eight major indexes. We’ve also included the average for each week so that we can evaluate the performance of a specific index relative to the overall mean and better understand weekly volatility. The colors for each index name help us visualize...On September 11, 2017 / By Kurt Osterberg -
Finance 0
The S&P Is Pushing Into New Highs
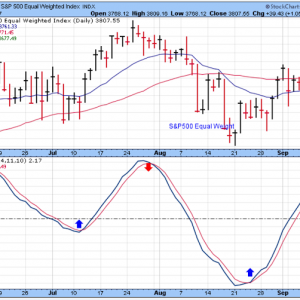
I was not too surprised that the hurricane was weaker than expected since we’ve all seen that many times before. But I definitely was not expecting a rally of this strength. The short-term uptrend has re-asserted itself. The SPX is pushing into new highs, so it seems time to switch the medium-term trend from down to up. This is a really good looking chart, although it does require an end-of-week confirmation. This summation index is confirming the uptrend. The Leader List I have changed this spreadsheet. The long-term leaders are blue, the short-term leaders are green and the ETFs showing recent strength are shown at the bottom. The S&...On September 11, 2017 / By Kurt Osterberg
Top Posts
-
 The Importance for Individuals to Use Sustainable Chemicals
-
 Small Businesses: Finding the Right Candidate for the Job
-
 How to Write the Perfect Thank You Letter After Your Job Interview
-
 3 Best Large-Cap Blend Mutual Funds For Enticing Returns
-
 China suspected in massive breach of federal personnel data


