Latest Posts
-
Finance 0
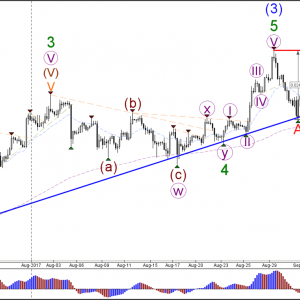
EUR/USD Builds ABC Retracement Back To Support Trend Line
EUR/USD 4 hour The EUR/USD continued to move lower as it approaches the support trend line (blue) yet again. The bearish bounce is indicating that the recent bullish momentum is probably a wave B (red), which is part of a larger ABC (red) correction. 1 hour The EUR/USD did not confirm the bullish break yesterday and in fact invalidated the bullish wave 4. A bearish 5 wave pattern seems to be unfolding within wave C (red). GBP/USD 4 hour The GBP/USD is challenging a deep 88.6% resistance Fibonacci retracement level of wave 2 vs 1 (red). A break above the 100% Fib level invalidates that wave 2 (red). Price could either be in an ABC (purple) cor...On September 12, 2017 / By Kurt Osterberg -
Finance 0
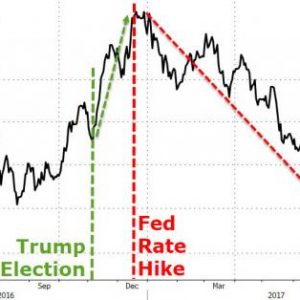
Some Are ‘Cheesed Off,’ But Here’s Why The Treasury Rally Can Continue
“At last Treasury yields are rising,” Bloomberg’s Paul Dobson writes, projecting what he imagines might be going through the heads of macro strategists the world over. “A glance over the latest weeklies suggests many of them are getting really cheesed off with the government bond market [and] JPMorgan is perhaps the most explicit,” Dobson adds, before quoting the bank as follows: Markets are all over the place. We can’t fully make sense of this line up … The bond rally in particular is out of line with other markets and with how we read the fundamentals. I guess. Although if you kind of step back from your models and just think...On September 12, 2017 / By Kurt Osterberg -
Finance 0
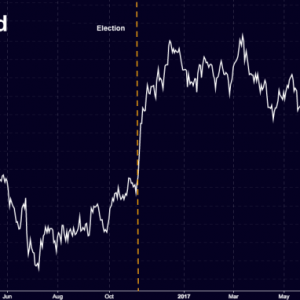
This Is The Dollar’s Worst Year Since The Plaza Accord
Entering 2017, the USD had been up four years running on a broad trade-weighted basis with 8.6% gains in 2014, 10.7% appreciation in 2015 and a more modest 3.0% move in 2016. That last year was a less dramatic move, but from May 2nd lows to the 15+ year peak on January 7th, the buck was up almost 9.3% or 14.5% at an annual pace. Unfortunately for greenback bulls, things have gone wildly off-script since. As Bespoke Investment Group details, the dollar has reversed its entire May 2016-January 2017 rally in a move that’s frankly shocked the FX world. As shown below, for the broad trade weight dollar, this was the worst year on record thro...On September 12, 2017 / By Kurt Osterberg -
Finance 0
GBP/USD Risks Larger Advance Ahead Of BoE On Strong U.K. CPI Report
Trading the News: U.K. Consumer Price Index (CPI) An uptick in the headline and core U.K. Consumer Price Index (CPI) may spark a bullish reaction in GBP/USD as it puts pressure on the Bank of England (BoE) to lift the benchmark interest rate off of the record-low. Even though the BoE is widely expected to retain the current policy at the September 14 meeting, signs of heightening price may encourage Governor Mark Carney and Co. to prepare U.K. household and businesses for higher borrowing-costs as officials argue ‘the withdrawal of part of the stimulus that the Committee had injected in August last year would help to moderate the infla...On September 12, 2017 / By Kurt Osterberg -
Finance 0
EURUSD Daily Analysis – Tuesday, Sept 12
EURUSD is facing the support of the ascending trend line from 1.1662 to 1.1823 on its 4-hour chart. A clear break below the trend line could bring price back to test 1.1823 support, below this level could signal completion of the uptrend from 1.1662, then the pair would find support at 1.1662. On the upside, as long as the price is above the trend line, the fall from 1.2092 would possibly be consolidation of the uptrend, and another rise towards 1.2165 is still possible after the consolidation....On September 12, 2017 / By Kurt Osterberg -
Finance 0
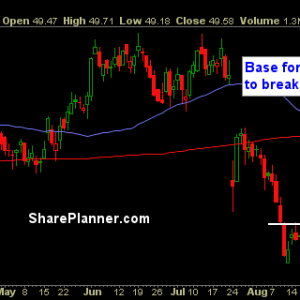
Stocks To Watch: RPM, DO, CCE
Today’s stock picks Long RPM Int’l (RPM) Long Diamond Offshre Drilling (DO) Short Coca-Cola European Partners (CCE)...On September 12, 2017 / By Kurt Osterberg -
Finance 0
Looks Like The COT Report Wins Again, As Gold And Silver Fall Sharply
Eventually physical demand for precious metals will swamp the games being played in the paper (i.e., futures contract) markets. So every time the commitment of traders report (COT), which tracks those paper games, turns bearish while gold and silver continue to rise, the precious metals community watches hopefully for signs that fundamentals are at long last about to ignite a massive bull run. The past couple of months followed this script (see Lightening-Fast COT Reversal: Now Fairly Bearish For Gold And Silver) as gold and silver kept rising for a while in the face of growing resistance in the paper market. Here’s a more detailed explana...On September 12, 2017 / By Kurt Osterberg -
Finance 0
1990s Bubble But In Reverse
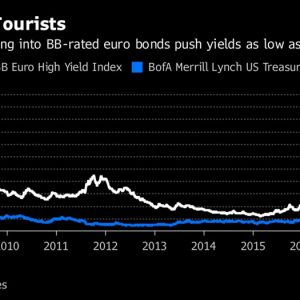
Update On ECB Bond Buying A new milestone is about to be reached in the ECB’s bond buying program. There have now been 998 bonds bought by the ECB. You can see the effects in the chart below. The BB rated euro high yield bond index is now at almost the same yield as the U.S. treasuries. That means there is no risk premium for junk debt. The unthinkable could happen in the next few weeks which would be junk bonds going below treasuries. Normally, investors would assign risk to lower grade bonds because they have default risk. We’re in a situation where defaults are low which shrinks the risk premium. The ECB’s buying puts it over the edg...On September 12, 2017 / By Kurt Osterberg -
Finance 0
Weekly Gasoline Price Update: Regular And Premium Remain High
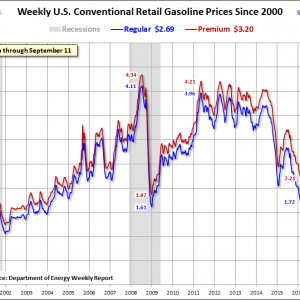
It’s time again for our weekly gasoline update based on data from the Energy Information Administration (EIA). The price of Regular and Premium are up a penny each from last week. According to GasBuddy.com, California has the highest average price for Regular at $3.15 and San Francisco, CA is the most expensive city, averaging $3.30. Oklahoma has the cheapest at $2.33. The WTIC end of day spot price closed at 48.07, a 1.2% decrease from this time last week. How far are we from the interim high prices of 2011 and the all-time highs of 2008? Here’s a visual answer. The next chart is a monthly chart overlay of West Texas Light Crude...On September 12, 2017 / By Kurt Osterberg
Top Posts
-
 The Importance for Individuals to Use Sustainable Chemicals
-
 Small Businesses: Finding the Right Candidate for the Job
-
 How to Write the Perfect Thank You Letter After Your Job Interview
-
 3 Best Large-Cap Blend Mutual Funds For Enticing Returns
-
 China suspected in massive breach of federal personnel data


