Latest Posts
-
Finance 0
Will Low Volatility Mean Lower Risk Next Time?
Well, it’s official. According to Ned Davis Research, this is now the longest period in history without the S&P 500 experiencing a correction of 3% or more. For those of you keeping score at home, NDR tells us that as of Monday’s close, it has now been 262 market days since the last time the S&P pulled back by at least 3%. The current run breaks the previous record of 256 days set back in 1995. To put this feat into perspective, consider that since 1928, the S&P has experienced a correction of at least 3% every 22 trading days (or about once a month) on average. It is for this reason that pullbacks of 3% or more are often r...On November 21, 2017 / By Kurt Osterberg -
Finance 0
US Existing Home Sales Beat Expectations – USD Ignores
Sales of second-hand homes are on the up, hitting an annualized level of 5.48 million in October, better than 5.42 million expected and 5.37 million beforehand. The rise is accompanied by another interesting fact: the level of inventories is at its lowest since 1999 – yes before the previous crisis and also 18 years ago. The good news fails to impress the US dollar, which is not rising even against weak currencies. EUR/USD is recovering from the lows and trading at 1.1740. The common currency suffered from the prospects of another round of German elections. GBP/USD is trading around 1.3250, within range and also up from the levels seen ear...On November 21, 2017 / By Kurt Osterberg -
Finance 0
Relationship Between Crude Oil And Oil Stocks
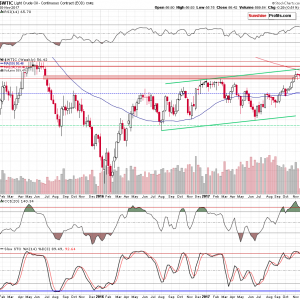
Although verification of the last week breakdown under important resistance line pushed black gold under $56, oil bulls didn’t give up and triggered a pullback. What does it mean for light crude? Will the relationship between crude oil and oil stocks give us more clues about future moves? Crude Oil’s Technical Picture Before we try to answer these questions, let’s examine the technical picture of crude oil (charts courtesy of StockCharts). Looking at the weekly chart, we see that the overall situation in the medium term hasn’t changed much as crude oil is still trading in a narrow range around the upper border of the red gap created i...On November 21, 2017 / By Kurt Osterberg -
Finance 0
World Markets Update – Tuesday, November 21
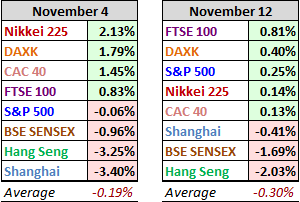
All eight indexes on our world watch list have posted gains for 2017 through November 20. The top performer thus far is Hong Kong’s Hang Seng with a gain of 33.0%, followed by India’s BSE SENSEX at 25.43%. In third is Tokyo’s Nikkei with 16.47%. The Last Four Weeks The tables below provide a concise overview of performance comparisons over the last four weeks for these eight major indexes. We’ve also included the average for each week so that we can evaluate the performance of a specific index relative to the overall mean and better understand weekly volatility. The colors for each index name help us visualize the comp...On November 21, 2017 / By Kurt Osterberg -
Finance 0
Could Hammond’s First Autumn Budget Be His Last?
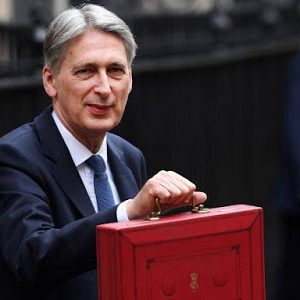
The UK Chancellor of the Exchequer Hammond is set to deliver his first Autumn budget tomorrow, and it could be his last. The UK government is fragile. Infighting is notorious. It appears the hardline Brexit camp does not trust Hammond. A cabinet reshuffle is widely rumored, and Hammond seems vulnerable. Prime Minister May, who also initially was in the Remain Camp, is said to regard Hammond suspiciously. Hammond is understood to be fiscally conservative, but he is hemmed in by the slowing economy, Brexit uncertainties, and a weak government. His proposal in the spring to have small businesses pay more for National Insurance fell fla...On November 21, 2017 / By Kurt Osterberg -
Finance 0
October 2017 CFNAI Super Index Moving Average Points To A Pickup In Growth
The economy’s rate of growth surged based on the Chicago Fed National Activity Index (CFNAI) 3 month moving (3MA) average – and economic growth is significantly above the historical trend rate of growth. Analyst Opinion of the CFNAI This Month The single month index which is not used for economic forecasting which unfortunately is what the CFNAI headlines. Economic predictions are based on the 3 month moving average. The single month index historically is very noisy and the 3 month moving average would be the way to view this index in any event. There was significant upward revision to the last 3 months of data. In the table in o...On November 21, 2017 / By Kurt Osterberg -
Finance 0
Learning From The 1980’s
Forget about big hair, Ray-Bans, and Donkey Kong. Don’t even think about Live-Aid, Thriller, and E.T. Above all else, the 1980s were the gravy days of the money supply aggregates. Beginning in late 1979, the Fed built its policy approach around the aggregates—primarily M1 but occasionally M2, and policymakers also monitored M3 while experimenting with M1B and, later, MZM. But those were just the “official” figures. Economists and pundits debated the Fed’s preferred measures while concocting their own home-brewed variations. Notably, the Fed allowed interest rates to fluctuate as much as necessary to achieve its money growth targets...On November 21, 2017 / By Kurt Osterberg -
Finance 0
Is USA Inc. A “Sell”
What would happen if I recommended a stock that had no profits, was losing billions of dollars a year, and had a net worth of negative $44 trillion? Chances are, you would cancel your subscription to the Mad Hedge Fund Trader, demand a refund, unfriend me on Facebook, and unfollow me on Twitter. What if you did an exercise analyzing the United States of America as a stand-alone corporation? The bottom line: the challenges are so great they would daunt the best turnaround, expert. The good news is that our problems are not hopeless or unsolvable. The US government was a miniscule affair until the Great Depression and WWII, when it exploded ...On November 21, 2017 / By Kurt Osterberg -
Finance 0
Technically Speaking: The Bull Won’t Die Easily
Just a short note for today as I am taking a quick vacation for the “Thanksgiving” holiday. As I noted this past weekend: “Thanksgiving week is traditionally an extremely ‘light’ trading period where the ‘inmates are running the asylum.’ With the market more overbought now than at any other period since 2011, a consolidation or further corrective action is entirely possible. While some ‘caution’ is advised, it is NOT advisable to act ’emotionally’ to swings due to the low volume trading that will be occurring. While the market is extremely overbought, the bullish trends remain intact. Furthermore, the last two m...On November 21, 2017 / By Kurt Osterberg -
Finance 0
Yield Curve Carnage Continues
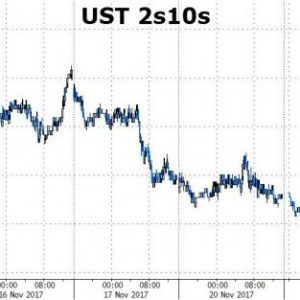
The US Treasury yield curve collapse continued its unending path to inversion overnight with 2s10s plunging to sub-60bps and 5s30s hits a 65bps handle for the first time since Nov 2007. 2s10s has flattened for 3 days straight, 6 of the last 7 days, and 14 of the last 17 days to a 58bps handle… 5s30s has flattened 3 days straight, 6 of the last 7 days, and 16 of the last 19 days to a 65bps handle… As a reminder, it took The Fed hiking rates to 5.25% in the last cycle before investors finally gave in and financial conditions tightened… for now as financial conditions ease towards record levels, despite a hiking and norm...On November 21, 2017 / By Kurt Osterberg
Top Posts
-
 The Importance for Individuals to Use Sustainable Chemicals
-
 Small Businesses: Finding the Right Candidate for the Job
-
 How to Write the Perfect Thank You Letter After Your Job Interview
-
 3 Best Large-Cap Blend Mutual Funds For Enticing Returns
-
 China suspected in massive breach of federal personnel data


