Latest Posts
-
Finance 0
Gold Fundamentals Not Bullish Yet
Too many technical analysts dismiss fundamentals. True, technicals usually lead fundamentals but understanding the fundamental drivers (when it comes to Gold) can give you an edge. Gold and gold stocks have remained below their 2016 peaks even in the face of a very weak US Dollar because the fundamentals are not there. Real rates have been stable in 2017 while the yield curve has been flattening. Until things change, Gold and gold stocks have little chance to breakout. If you follow my work you know that there is a strong inverse correlation between the Gold price and real interest rates. Gold performs best when real rates are declining an...On November 29, 2017 / By Kurt Osterberg -
Finance 0
U.S. Treasuries: The World Is Flat After All…At Least For The Yield Curve
A recurring theme that continues to garner attention among investors has been the seemingly relentless flattening of the U.S. Treasury (UST) yield curve. Indeed, it is a topic I have addressed multiple times over the last few months, but given its ongoing importance among market participants—as well as the financial media—I feel it is necessary to provide updates on both current developments and our insights on the matter. Without a doubt, the flattening of the yield curve has been the overarching theme year-to-date. However, it was the more recent bout of narrowing between the UST 2-Year yield and the UST 10-Year yield that has mor...On November 29, 2017 / By Kurt Osterberg -
Finance 0
Should Investors Worry About North Korea’s Missile Tests?
North Korea on Wednesday announced that it had launched another missile to test its nuclear-strike capability, which reportedly can now reach the United States. Should we be concerned? Yes, of course. For obvious reasons, every citizen of Planet Earth should be alarmed when a war-mongering government threatens to use nuclear weapons. But as investors, Kim Jong Un’s provocations should be treated as noise. In fact, the US stock market seems to be increasingly immune to North Korea’s ongoing military exercises. In 2016 and 2017 (excluding the latest launch) , the rogue regime successfully tested missiles 15 times and conducted three nu...On November 29, 2017 / By Kurt Osterberg -
Finance 0
US Futures, World Stocks, Bitcoin All Hit Record Highs
US equity futures continued their push higher overnight (ES +0.1%), and the VIX is 1.5% lower and back under 10, after yesterday’s blistering surge in US stocks which jumped 1%, the most since Sept. 11, following Powell’s deregulation promise, ahead of today’s 2nd estimate of U.S. Q3 GDP which is expected to be revised up. U.S. Senate Budget Committee sent the tax bull to the full chamber to vote, and on Wednesday Senators are expected to vote to begin debating the bill. The biggest mover of the session however was bitcoin, which topped $10,000 in a buying frenzy which saw it go from $9,000 to $10,000 in one day, and which ...On November 29, 2017 / By Kurt Osterberg -
Finance 0
Sterling Charges Ahead On Brexit Hopes
Prospects of a deal with the EU has sent sterling to its best level in two months against the dollar. It reached $1.3430 in early European turnover. It had sunk to nearly $1.3220 yesterday as European markets were closing, which was a four-day low. It is the strongest of the major currencies today, gaining about 0.4%. With today’s gains has met our retracement target near $1.3415. The momentum appears to give it potential toward $1.3500 in the near-term. Sterling has been trending higher since the middle of the month, largely as a function of the broad dollar weakness. However, the move over the past 24 hours is the reports that sug...On November 29, 2017 / By Kurt Osterberg -
Finance 0
Tax Gimmicks
Podcast: Play in new window | Download (Duration: 13:16 — 7.6MB) DOW + 255 = 23,836 SPX + 25 = 2627 NAS + 33 = 6912 RUT + 23 = 1536 10 Y + .01 = 2.34% OIL – .36 = 57.75 GOLD – .60 = 1294.40 Cryptocurrency Number of Currencies: 916 Total Market Cap: $318,106,894,241 24H Volume: $16,102,299,246 Top Cryptocurrencies Name Symbol Price USD Market Cap Vol. Total Vol. % Price BTC Chg. % 1D Chg. % 7D Bitcoin BTC 10,028.0 $170.97B $6.71B 41.70% 1 +1.31% +25.73% Ethereum ETH 476.79 $46.48B $1.43B 8.89% 0.0480758 +2.41% +33.12% Bitcoin Cash BCH 1,465.90 $25.65B $1.25B 7.74% 0.151402 -1.06% +28.52% Ripple XRP 0.26999 $11.22B $...On November 29, 2017 / By Kurt Osterberg -
Finance 0
What Will OPEC Do Next?
Oils traders have been watching OPEC and OPEC+ meetings closely – even though their attempt to stifle oil production had been derailed, both by some of its own members and by the U.S. ramping up their own production to offset the slowing of production. Their intent was to slow production to diminish global crude reserves – bringing the price of oil up. Although recently we have seen oil inch up and fall slightly today, Tuesday – Brent was trading at $63.34 and US light crude was trading at $57.61 – it seems that the OPEC+ 1.8 m barrels/day cut didn’t seem to as effective as they hoped. At this point and taking into consideration the...On November 29, 2017 / By Kurt Osterberg -
Finance 0
Bitcoin > $10,000 – Levels To Watch
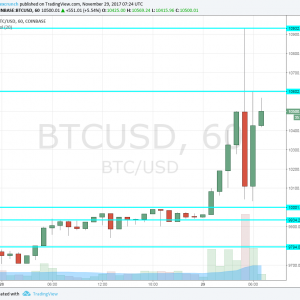
BTC/USD just crossed the closely-watched $10,000 line. This was eyed by many people and become closer to reality over the weekend. After Bitcoin achieved the big prize, is the sky the limit? Will this extra publicity trigger even higher levels such as 15K or 20K? Or will some investors and speculators cash out and sell the cryptocurrency sending the price lower? The move above $10,000 took its time with cautious trading just under the magic number. But when it broke higher, it went all the way to a new high of 10,928 dollars. From there, we had some profit taking and $10,622 seems to be forming a level of resistance. Here is the hourly chart...On November 29, 2017 / By Kurt Osterberg -
Finance 0
GBP/USD Second Bullish Breakout Above 1.33 Resistance Zone
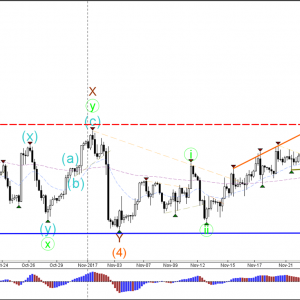
GBP/USD 4 hour The GBP/USD made a bearish bounce at the resistance (red) zone but then found strong support about half way the range. The bullish bounce is showing strong momentum and price could now be ready for a larger bullish breakout. For the moment the bearish wave 4 of yesterday seems unlikely after this bullish break and price could be ready for a wave 5 (orange). 1 hour The GBP/USD could be building a wave 1 (green) within wave 3 (brown). EUR/USD 4 hour The EUR/USD seems to have completed a wave 1 (pink) and price could now be building a wave 2 retracement (pink). 1 hour The EUR/USD completed an ABC (blue) zigzag yesterday but price ...On November 29, 2017 / By Kurt Osterberg -
Finance 0
Gold Eases As Dollar Gains On Strong U.S. Data
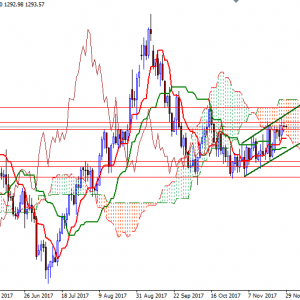
Gold prices ended Tuesday’s session down $0.63 as the dollar strengthened on the back of the better-than-expected U.S. data. The Conference Board’s consumer confidence index came in at 129.5, up from the previous month’s 126.1 and above expectations for a reading of 123.9. XAU/USD traded as low as $1290.58 an ounce, but the market ended the day above the $1292-$1291 zone. The market is trading above the Ichimoku cloud on the H4 and the H1 time frames, suggesting that the bulls still have the short-term technical advantage. However, as I pointed out yesterday, XAU/USD has to anchor somewhere above the 1296.80-1296 area to make a run for ...On November 29, 2017 / By Kurt Osterberg
Top Posts
-
 The Importance for Individuals to Use Sustainable Chemicals
-
 Small Businesses: Finding the Right Candidate for the Job
-
 How to Write the Perfect Thank You Letter After Your Job Interview
-
 3 Best Large-Cap Blend Mutual Funds For Enticing Returns
-
 China suspected in massive breach of federal personnel data


