Latest Posts
-
Finance 0
The Asymmetry Of Bubbles: The Status Quo And Bitcoin
Shall we compare the damage that will be done when all these bubbles pop? Regardless of one’s own views about bitcoin/cryptocurrency, what is truly remarkable is the asymmetry that is applied to questioning the status quo and bitcoin. As I noted yesterday, everyone seems just fine with throwing away $20 billion in electricity annually in the U.S. alone to keep hundreds of millions of gadgets in stand-by mode, but the electrical consumption of bitcoin is “shocking,” “ridiculous,” etc. Since the U.S. consumes about 20% of the world’s energy, we can guesstimate the total amount of electricity wasted on stand-...On November 30, 2017 / By Kurt Osterberg -
Finance 0
AUDUSD Daily Analysis – Thursday, Nov. 30
AUDUSD’s fall from 0.7644 extended to as low as 0.7552. Deeper decline to test 0.7532 support is possible and a breakdown below this level could signal resumption of the downtrend from 0.7897, then next target would be at 0.7450 area. Key resistance is at 0.7644, only break above this level will indicate that the downtrend had completed at 0.7532 already, then next target would be at 0.7729....On November 30, 2017 / By Kurt Osterberg -
Finance 0
Gold Swings Down As Dollar Advances
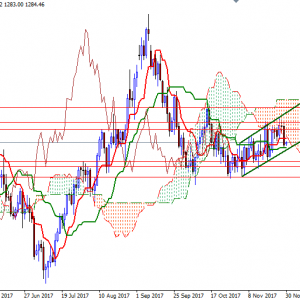
Gold prices closed at their lowest level in a week on Wednesday, under pressure from a stronger dollar rising stock markets. In economic news, the Commerce Department reported that the U.S. economy grew at a 3.3% pace in their third quarter. Federal Reserve Chair Janet Yellen said “We continue to expect that gradual increases in the federal funds rate will be appropriate to sustain a healthy labor market and stabilize inflation around (our) 2 percent objective.” The market’s inability to pass through the resistance in the $1296.80-$1296 area was also behind yesterday’s %0.8 decline. Not surprisingly, breaking below the support in ...On November 30, 2017 / By Kurt Osterberg -
Finance 0
Bitcoin Smashes Through $11,000 In A Wild Swing
Bitcoin continued to surprise investors and analysts as the cryptocurrency blasted through $11,000 a coin to all-time high of $11,395 on Thursday. A 15 percent increase from Wednesday’s peak of $10,787.99. So far, the coin has gained more than 1,000 percent in 2017 even as some experts called for caution and proper regulation of the digital currency. According to Neil Wilson, a senior market analyst at CFD provider ETX Capital, Bitcoin rise as “a massive speculative bubble”. “It’s hard to say precisely where we are in the curve, but the shape of the chart is parabolic and this sort of thing never, ever lasts. So far it’s following...On November 30, 2017 / By Kurt Osterberg -
Finance 0
Further Signs Of Strengthening In The Eurozone
The common currency had opened last week on a somber note as reports about the coalition talks in Germany put Angela Merkel in a weak spot. The euro briefly fell after the news, as the possibility of a snap election emerged. However, the currency managed to recover from the initial decline as economic data from the Eurozone continued to show positive developments. German Ifo business sentiment hits a new record The Ifo institute in Germany released its monthly business sentiment indicator. Data showed that business sentiment in Germany reached a new record high. Companies said that they have upgraded their outlook on the economy for the month...On November 30, 2017 / By Kurt Osterberg -
Finance 0
USD/JPY Bullish Breakout Approaches Key 112.50 Resistance
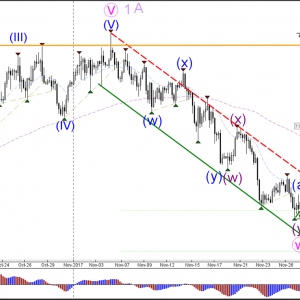
USD/JPY 4 hour The USD/JPY broke above the resistance of the bearish channel (dotted red). The bullish breakout could indicate the completion of wave 2 or wave B (purple) as well. The key levels are the Fibs of wave X (pink) because a bearish bounce could see price fall towards the 61.8% at 110. Strong bullish momentum makes a wave X (pink) unlikely. 1 hour The USD/JPY is either in a wave C (blue) or wave 3. A wave C is more likely if price stops at the 38.2% or 50% Fibs of wave X vs W. A key resistance level is also the 112.50 round figure. EUR/USD 4 hour The EUR/USD bearish retracement has reached the support trend line (blue) which is a bu...On November 30, 2017 / By Kurt Osterberg -
Finance 0
International Financial ETFs Versus 3 Major World Indices
It appears that several international Financial ETFs have, generally, performed well over the past couple of years and are, either approaching major resistance, or have already reached it, when compared with their respective country’s Major Index on a ratio basis. The first is the XLF:$SPX ratio, as shown on the 5-Year Daily ratio chart below. The second is the EUFN:$STOX50 ratio, as shown on the 5-Year Daily ratio chart below. The last is the GXC:$SSEC ratio, as shown on the 5-Year Daily ratio chart below. The following graph shows the percentages gained by the 3 Major Indices and 3 ETFs during the past 5 years. The next gra...On November 30, 2017 / By Kurt Osterberg -
Finance 0
US Dollar: Senate Tax Plan Vote, PCE Inflation Data In The Spotlight
Eurozone CPI takes top billing on the European data docket, with the headline inflation rate expected to have hit a seven-month high at 1.6 percent on-year in November. Meanwhile, the German labor-market statistics are expected to leave the jobless rate unchanged at 5.6 percent while Swiss GDP figures point to accelerating growth in the third quarter. None of these outcomes seem likely to generate a lasting response from FX markets however. ECB policy looks to be on auto-pilot in the near term, severing the link between regional data flow and the Euro. A surprise SNB policy pivot isn’t out of the question but a single data point...On November 30, 2017 / By Kurt Osterberg -
Finance 0
FV Anatomy Of A Bubble 101
Video Length: 00:22:56 This has the potential to be a top, or it could just intensify the bubble mentality even more if not making it even that much more likely that investors get caught when the top arrives. The more times the market recovers the more convinced traders become that there is no risk thus causing them to hold too long and get trapped when the final top does occur....On November 30, 2017 / By Kurt Osterberg -
Finance 0
S&P 500 And Nasdaq 100 Forecast – Thursday, Nov. 30
S&P 500 The S&P 500 went back and forth during the trading session on Wednesday, initially breaking out to the upside but turning around to form a shooting star. The shooting star of course is a very negative sign, and I believe that we could see a bit of a pullback. The 2600 level underneath should be massive support as it was previous resistance, and the market of course has been a bit overbought. I believe that a break above the top of the shooting star for the day would be a bit of a blow off top, but we are crossing on the Stochastic Oscillator in the overbought area, so I think it makes quite a bit of sense that we pull back, lo...On November 30, 2017 / By Kurt Osterberg
Top Posts
-
 The Importance for Individuals to Use Sustainable Chemicals
-
 Small Businesses: Finding the Right Candidate for the Job
-
 How to Write the Perfect Thank You Letter After Your Job Interview
-
 3 Best Large-Cap Blend Mutual Funds For Enticing Returns
-
 China suspected in massive breach of federal personnel data


