Crude price reversal targeting initial resistance targets- Interim bullish invalidation at 67.14
Crude prices are up nearly 7.5% off the August lows with the reversal now approaching the monthly opening-range highs. Here are the updated targets and invalidation levels that matter on the Crude Oil price charts this week.
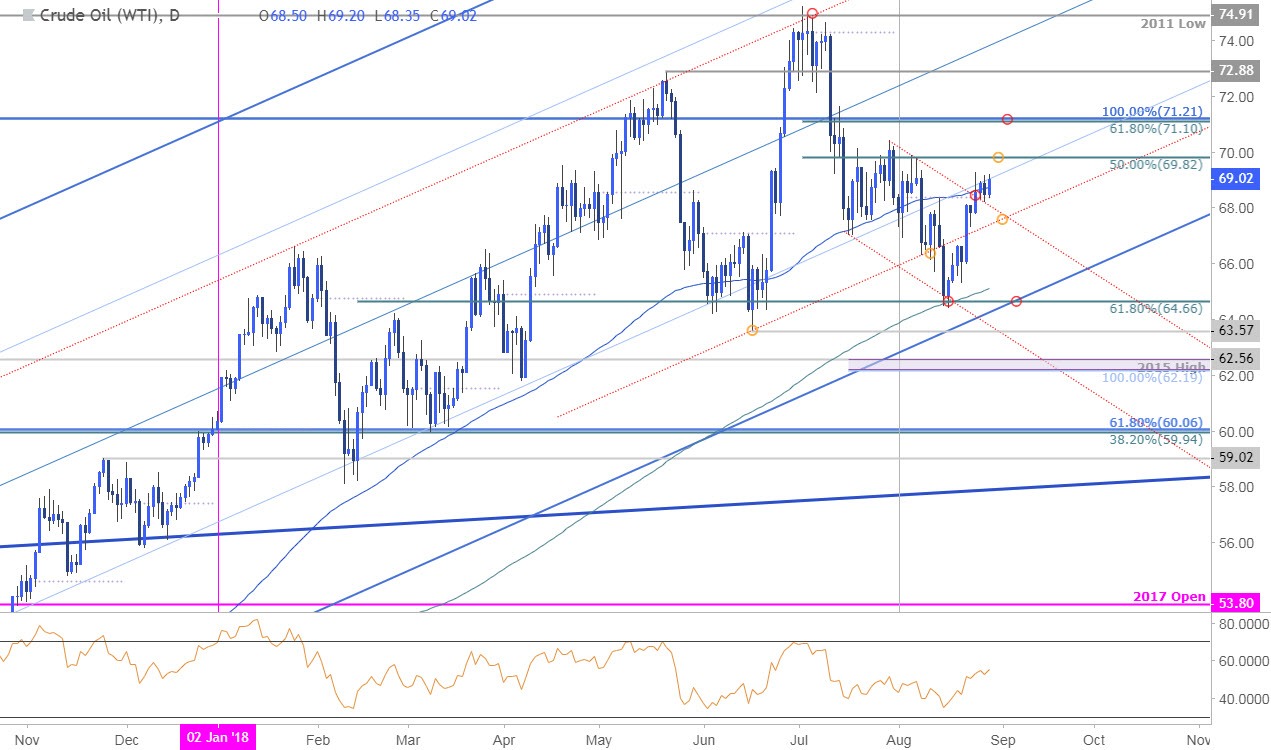
CRUDE OIL DAILY PRICE CHART (WTI)

Technical Outlook: In my previous Crude Oil Price Outlook we noted that “Daily confluence support rests at 64.55/66 where the 61.8% retracement of the yearly range converges on the 200-day moving average and down-slope support. Broader structural support rests at the lower parallel (blue) / June lows at 63.57– We’re looking for a reaction / possible exhaustion off one of these levels.” Price registered a low at 64.40 the next day with the subsequent reversal clearing channel resistance / monthly open at 68.39 – constrictive.
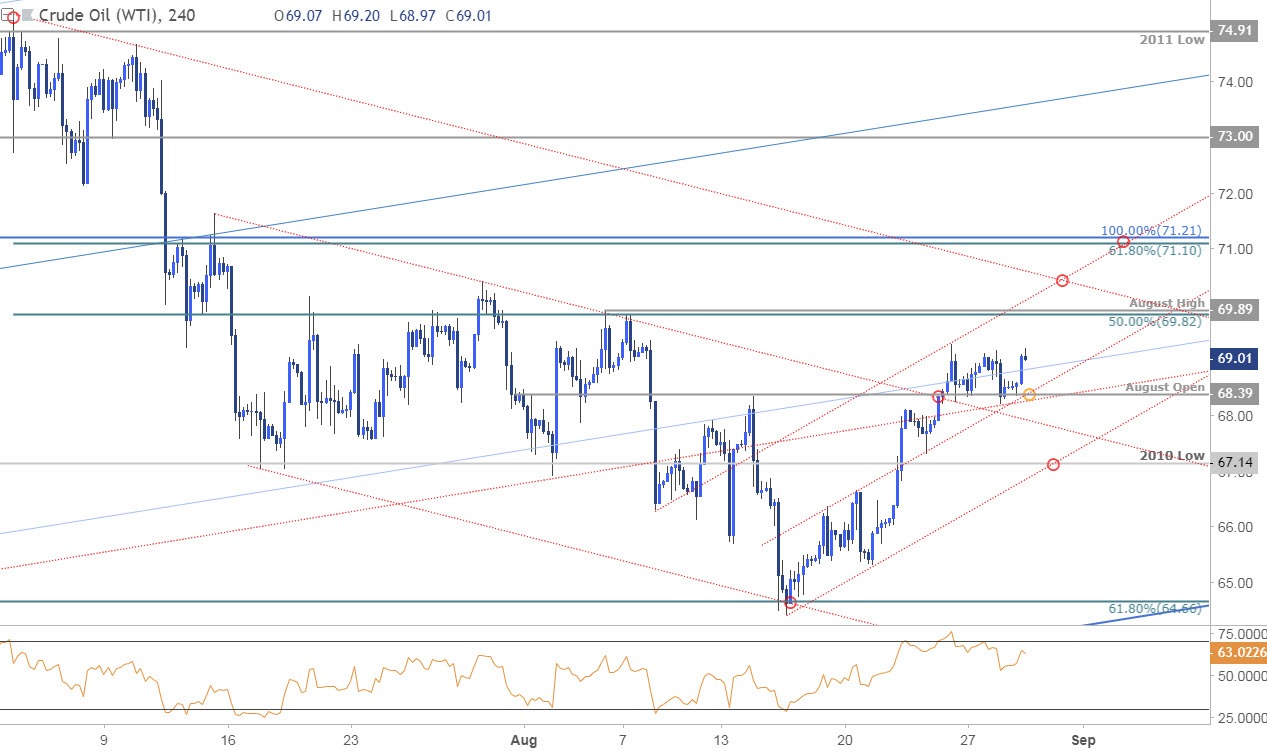
CRUDE OIL 240MIN PRICE CHART (WTI)

Notes: A closer look at crude sees price trading within the confines of an ascending slope formation with a breakthrough and test of the monthly open resistance as support, keeping the focus higher in price. Interim support rests at 68.39 with near-term bullish invalidation now raised to the lower parallel / 2010 low at 67.14. Initial resistance targets are eyed at 69.82/89 backed by the trendline confluence around ~70.40 and a more significant Fibonacci confluence at 71.10/21.
Bottom line: Crude has responded to key longer-term structural support and leaves the risk-weighted to the topside while above 67. Ultimately a breach above the objective monthly opening-range highs would be needed to validate resumption of the broader uptrend.
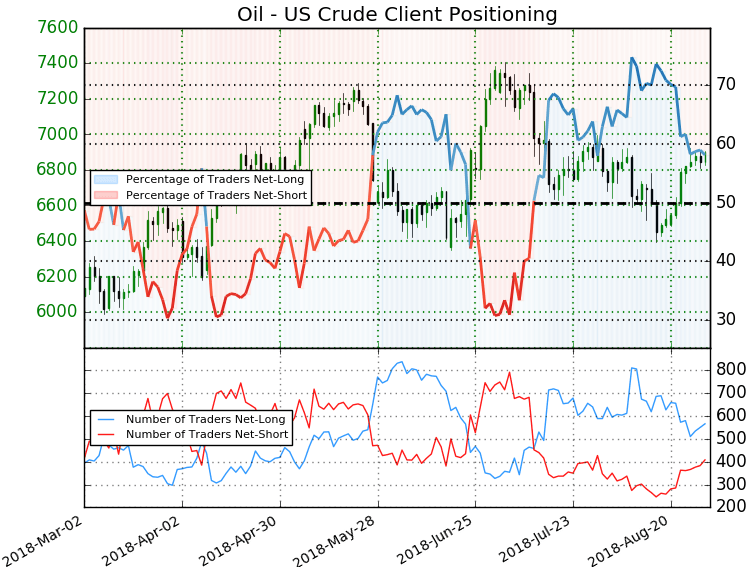
CRUDE OIL TRADER SENTIMENT


No Comments