

I could write a long, detailed post trying to encompass global stock markets (generally bearish), commodities (bounce very mature) and bonds (mixed views, depending upon the flavor) but that is what I get paid to do each weekend in NFTRH reports and in private posts at the site. The beauty of public posts is that I can write as much or as little as I feel like writing. Today I feel like writing a little about gold (and silver) and the stock market. I also feel like using daily charts because I think time frames are pinching in for upcoming pivotal moves.
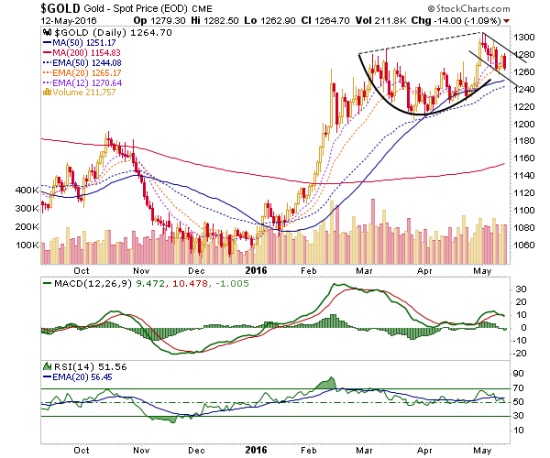
Gold is in a rather orderly Handle to a short-term Cup & Handle. Personally, I think gold and the precious metals complex need a correction because [insert CoT, Sentiment and over bought reasoning here]… But the chart thinks otherwise. If the Handle breaks upward and gold exceeds 1300, the measured target is to around 1370. It if goes the other way, watch for support beginning at the October high of 1191 down to 1180, figuring for wiggle room.
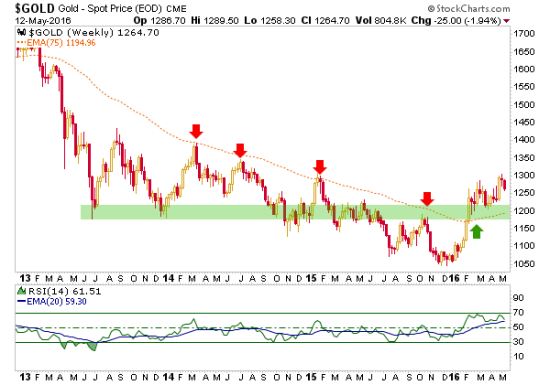
The weekly chart’s EMA 75, the former bear market shackle, agrees with that support.
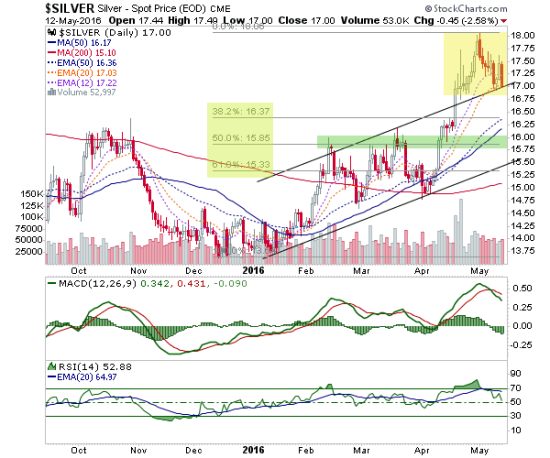
Silver… if it looks like a short-term top and it quacks like a short-term top, is it a short-term top? If it is then the best support looks to be the 50% Fib retrace at 15.85.
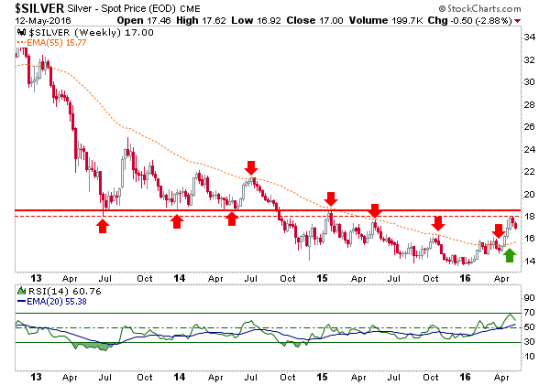
Silver weekly shows the former bear market ball and chain as the EMA 55 at 15.77. Close enough to the 50% Fib to be in agreement on the general support area.
Silver would need to break below the daily chart’s EMA 20 (and the top channel line) to indicate that a correction is on. So far it is clinging to support. If that is given up, watch for the mid/high 15’s as a correction target.
The Gold-Silver ratio continues to show a bottoming stance after hitting deeply over sold levels. I like to use Silver-Gold when projecting a beneficial asset market environment and I like to flip it over to Gold-Silver when projecting a dangerous one. Well, it is flipped over…


No Comments